

Most vegetable crops can get access to the nutrients they need at a soil pH from about 6 to 7 (from slightly acidic to neutral). If the pH drops lower than that range, nutrients become locked away while aluminium starts to poison your crop. Move higher and iron, manganese and zinc gradually become inaccessible, so plants can go hungry even if there is an abundance in the soil.
You can think about it like this: you wouldn’t feed a baby a whole apple. There’s nothing wrong with the apple, but it’s not in the right form for the baby. You would process it first to get it in the right form, apple purée. Managing the pH of your soil is about keeping the pH in the right range so your plants (your babies) get access to their food (soil nutrients) in the right form.
If you just want to sort out your own garden beds, there are three steps:
- Test it. A home dye kit gives you a reading in a few minutes. How to test your soil pH
- Read it. Somewhere from 6 ↔ 7 suits most veggies, and you can stop there. Check the range for your crop
- Fix it, if you need to. Too acid? Raise it with lime. Too alkaline? Lower it with sulfur.
But if you are curious we’ve made this page to explore how pH affects your garden soil.
Soil pH and its effect on Nutrient Availability and Soil Life
You can drag the vertical marker below to watch each nutrient become available or unavailable as the pH changes, or if you’ve measured the pH in a garden bed, drag the marker to that reading. It also shows how pH affects different life in your soil.
At pH 6.5
slightly acid
Inside the sweet spot for most veggies.
- Easy to reach
- nitrogen, potassium, calcium, magnesium, phosphorus, sulfur, chlorine, iron, manganese, boron, zinc, copper, molybdenum, nickel and cobalt
- Soil life
- Bacteria, actinomycetes, nitrifiers, rhizobia, archaea, mycorrhizal fungi and earthworms going well. Fungi slowing.
NutrientTurns maroon: too muchToxicitySoil lifeSweet spot for most veggies
Each ribbon represents one element: its broad sections show easy uptake by roots, and its narrow, pinched sections show the element being locked up.
Download a printable chart (PDF)
About this chart
This chart is based on Emil Truog’s 1946 diagram1, which itself grew out of earlier work. We copied parts of the Potash Development Association’s version2. Then we made a few changes: using current soil-science references. Each entry below explains where its shape comes from. With chlorine, nickel and cobalt, I’m working from my best estimates. Truog didn’t include those three, so I’ve used the direction given in soil textbooks, not measured curves.
Truog designed this chart to teach with, using healthy well-drained mineral soils in humid regions as his context. It’s not meant to be pinpoint accurate, but it can give you a sense of what’s happening in your soil. A wider or narrower band tracks which way availability is heading. It doesn’t tell you how much of anything is actually in your soil3,4. Every pH figure here is pH in water, which is what home kits and cheap meters read. We sampled Manutec’s soil pH colour chart to approximate the colours on home test kits5. For names, the readout uses the USDA’s soil reaction classes, from very strongly acid through to strongly alkaline6.
How to test your soil pH
Test the soil before you add lime or sulfur, or decide the plants are the problem. pH isn’t something you can see, and what’s growing above it won’t give you a dependable answer.
With a home test kit
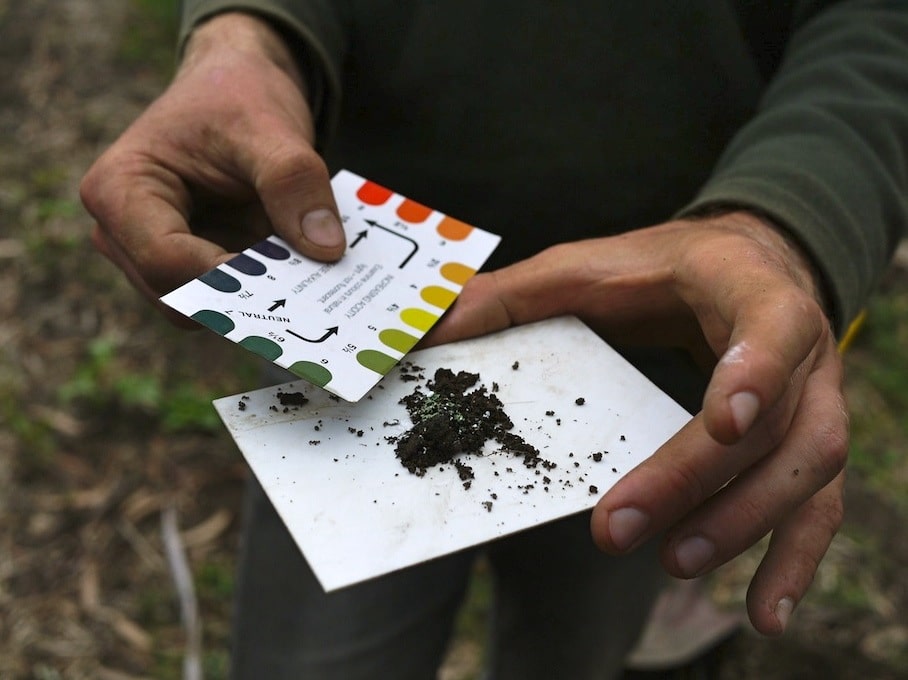
Developed by the CSIRO, this dye-and-powder kit is where most of us begin. I’ve been using these to test the soil in my gardens for over 20 years. Look for the Manutec or INOCULO soil pH kit. Both versions work exactly alike.
For vegetables and other shallow-rooted plants, sample at a depth of 10 to 15 cm, then remove any mulch, stones or roots and finely crumble the soil7. For larger areas, the kit makers suggest mixing soil collected from several spots across the bed and testing a half-teaspoon of that blend7. On a first test, though, I’d rather check six or so spots individually, because a strange result could be a one-off. If a single corner gives a wildly different result, treat that area separately.
Use only enough drops of dye to create a thick paste when stirred, then dust the top with white powder and wait… within roughly a minute, the dye’s colour will show in the powder, ready to match against the card7. Read the result in daylight, since artificial lighting can skew the colours5.
- 4
- 4.5
- 5
- 5.5
- 6
- 6.5
- 7
- 7.5
- 8
- 8.5
- 9
- 9.5+
The colour card they provide moves in half-unit steps5. That gives enough detail to tell whether a soil needs lime or not. This chart uses pH in water, and the kit’s readings come close to it8. Age and heat also fade the dyes, so store the kit in a cool place9.
With a pH meter
You can buy an excellent pH meter, or one that’s nearly useless, and telling them apart is where things get confusing.
| Meter | How it works | Good for | The catch |
|---|---|---|---|
| Cheap two- or three-prong probe | Metal probes pushed into the soil, often with a moisture and light dial too. | Not much, for pH. | In a University of Missouri trial the probe couldn’t tell apart soils more than 2 pH units apart9,10. |
| Kelway HB-2 and Kelway Soil pHD | Two metal plates in moist soil make a tiny current, read on a needle. No batteries and no buffer solutions11. | Quick spot readings around the garden, again and again. | The plates must be scrubbed clean with the conditioning film first, the soil needs to be moist, the needle takes 2 to 3 minutes to settle, and the maker says not to use it in saline or alkaline soil11. |
| Calibrated spear-tip meter, like the Hanna HI99121 or the Bluelab Soil pH Pen | A glass electrode pushed into moist soil, or dipped into a soil and water slurry, calibrated against buffer solutions12,13. | Readings you can compare with a lab, if you look after it. In the University of Missouri trial a calibrated hand-held meter came closest to the labs9,10. | It needs fresh buffers and regular calibration (Bluelab says at least monthly), and the electrode must never dry out9,13. |
Calibration is the feature to look for when buying.
Some Australian labs mix 1 part soil with 5 parts distilled water, so use that ratio for readings you can compare with theirs. Stir them together, let the mixture settle, then measure the liquid14. Pick one method and keep using it, because a different soil-to-water ratio will shift the reading slightly9.
With a lab test
Before a major decision about lime or sulfur, on a larger scale, a laboratory test is probably worth the cost, since it provides cation exchange capacity, nutrient levels and exchangeable aluminium alongside pH, and many labs will calculate your lime requirement too8,15.
When to test, and how often
Test in the same season each year, ideally in autumn after rain, and avoid testing soon after lime or fertiliser, since pH shifts with the seasons and with recent additions8,9. Record each result in your garden diary. The long-term trend will reveal much more than a single reading.
Keep the tests bed-by-bed as well. Years of compost can make an established bed read differently from one just cut out of a lawn, so combine samples within each bed rather than across beds7. If you’re planning entirely new beds, our backyard vegetable garden design guide is a useful first stop.
How to raise soil pH: lime, dolomite and wood ash
The standard way to raise pH is by adding agricultural lime (calcium carbonate, rather than builders’ lime), while dolomite (calcium-magnesium carbonate) works, but only in soils that have low magnesium8,16.
The required rate depends on the soil’s acidity and its clay and organic-matter content, since clayey and humus-rich soils need considerably more to achieve the same change16. Go slow and steady. A rough guide is about 200 g/m² in one dose, then test again the following year before adding more17.
Don’t expect lime to act quickly. Even fine lime needs several months to begin working and up to three years to reach full effect, and it barely moves down through the soil by itself, so mix it in well ahead of planting16.
Be careful not to apply too much lime… once pH is above about 7, phosphorus, boron, iron, manganese and zinc all become harder for plants to access16.
Wood ash and gypsum
Wood ash also lifts pH and supplies potassium and calcium, but it is caustic and only 25 to 60% as strong as lime. On a garden already close to its target, cap annual applications at about 100 g/m², and don’t use it near blueberries, azaleas or potatoes, as it encourages scab18.
Gypsum supplies calcium without raising pH, which is precisely what makes it useful on sodic soils19.
How to lower soil pH: sulfur and organic matter
Elemental sulfur is the standard material for lowering pH, and gentle applications are the trick. Soil bacteria convert it gradually into sulfuric acid, a process that takes months and needs warm, moist soil, so you often won’t see what a dose has done until the next season20,21,22.
That means you’ll need to do multiple small applications, with time between for the soil to respond, rather than a single heavy one. For medium soils, about 100 g/m² for each pH-unit drop20. Sandy soil will need about a third less and clay about a third more. Never go over about 150 g/m² of elemental sulfur20. A large single application can burn roots, even on blueberries23. Take it slow and steady and think of the soil life, it all has to adjust to the change too.
Fertilisers, manure and pine needles: what does and doesn’t acidify soil
Over time, synthetic ammonium fertilisers such as sulfate of ammonia also make soil more acid15. Aluminium sulfate acts quickly, but it adds aluminium, making elemental sulfur the better option.
Don’t use manure to acidify soil. If anything, manures nudge the pH of acid soil upwards, and laying-hen manure contains enough calcium carbonate to behave like a weak lime… keep your blueberries and chook manure well apart24,25.
A layer of pine needles makes lovely mulch beneath blueberries, conserving moisture around their shallow roots without raising pH. Despite the old saying, they do little to lower pH by themselves, because soil organisms neutralise the needles during decomposition26,27. Pine bark and acid composts are also useful in the planting hole. Limestone based soils still can’t practically be acidified, so use a raised bed or a large pot of acid mix for blueberries instead (no-dig pots are a good option here).
Soil pH for every crop, A to Z
Starting with the most acid-loving crops at the top, this scale puts 16 common veggies side by side. A band is at its widest where that crop is happiest, then tapers towards the pH limits it will accept28.
124 crops
No crop in the chart matches that.
Fat: the pH it likes bestThin ends: what it will put up withSweet spot for most veggies
| Crop | Likes best | Will put up with |
|---|---|---|
| Amaranth | 5.8 to 7.0 | 5.5 to 7.0 |
| Arrowroot | 5.5 to 6.5 | 5.5 to 6.5 |
| Asparagus | 6.0 to 7.0 | 5.0 to 8.0 |
| Basil | 6.0 to 7.5 | 5.0 to 8.0 |
| Beetroot | 6.0 to 7.0 | 5.5 to 7.5 |
| Bitter melon | 6.0 to 6.5 | 5.0 to 7.0 |
| Bok choy | 5.5 to 7.0 | 5.5 to 7.5 |
| Borage | 6.3 to 7.8 | 6.0 to 8.0 |
| Bottle gourd | 6.0 to 7.0 | 6.0 to 7.5 |
| Broad bean | 6.0 to 7.5 | 6.0 to 8.6 |
| Broccoli | 6.0 to 6.8 | 5.5 to 7.5 |
| Brussels sprouts | 6.0 to 7.0 | 5.8 to 7.5 |
| Bush bean | 5.7 to 7.2 | 5.0 to 7.5 |
| Butternut | 5.8 to 7.0 | 5.8 to 7.0 |
| Cabbage | 6.0 to 7.0 | 5.5 to 7.5 |
| Calendula | 5.5 to 7.0 | 5.5 to 7.0 |
| Cape gooseberry | 5.5 to 6.5 | 5.0 to 6.5 |
| Capsicum | 5.7 to 6.8 | 5.0 to 7.0 |
| Cardoon | 5.5 to 7.0 | 5.0 to 7.5 |
| Carrot | 5.8 to 6.8 | 5.0 to 7.5 |
| Cassava | 5.3 to 7.1 | 5.3 to 7.1 |
| Cauliflower | 6.0 to 6.9 | 5.5 to 7.8 |
| Celeriac | 6.0 to 6.8 | 5.8 to 7.0 |
| Celery | 5.9 to 6.9 | 5.0 to 7.5 |
| Chamomile | 5.0 to 7.0 | 5.0 to 7.0 |
| Chervil | 6.0 to 7.5 | 6.0 to 8.0 |
| Chicory | 5.8 to 7.5 | 5.6 to 7.6 |
| Chilli | 5.7 to 6.8 | 5.0 to 7.0 |
| Chives | 6.0 to 7.0 | 5.8 to 7.0 |
| Choko | 5.5 to 7.0 | 5.0 to 7.0 |
| Choy sum | 5.5 to 6.5 | 5.5 to 7.0 |
| Climbing bean | 5.7 to 7.2 | 5.0 to 7.5 |
| Collards | 5.8 to 6.5 | 5.5 to 7.5 |
| Coriander | 6.3 to 7.5 | 4.5 to 8.0 |
| Corn salad | 6.0 to 7.0 | 6.0 to 7.0 |
| Cowpea | 5.5 to 6.5 | 5.0 to 8.0 |
| Cucumber | 6.0 to 6.9 | 5.0 to 7.5 |
| Dahlia | 6.3 to 7.0 | 6.3 to 7.0 |
| Daikon | 6.0 to 6.5 | 5.0 to 7.0 |
| Dill | 6.0 to 7.0 | 5.5 to 8.0 |
| Edamame | 6.0 to 6.5 | 5.8 to 6.8 |
| Eggplant | 5.9 to 6.7 | 5.0 to 7.5 |
| Endive | 5.8 to 7.8 | 5.5 to 8.3 |
| Fenugreek | 6.0 to 7.5 | 5.3 to 8.2 |
| Florence fennel | 6.3 to 7.8 | 5.5 to 8.0 |
| Garden cress | 6.0 to 7.0 | 6.0 to 7.5 |
| Garlic | 5.7 to 6.9 | 5.5 to 8.0 |
| Garlic chives | 6.0 to 7.0 | 6.0 to 8.0 |
| Ginger | 6.0 to 7.0 | 5.8 to 7.5 |
| Globe artichoke | 6.3 to 7.0 | 6.0 to 8.0 |
| Hamburg parsley | 5.7 to 7.4 | 5.3 to 7.4 |
| Horseradish | 6.0 to 7.0 | 6.0 to 7.5 |
| Jerusalem artichoke | 5.9 to 6.8 | 4.5 to 7.0 |
| Kale | 5.9 to 6.9 | 5.5 to 7.5 |
| Kohlrabi | 6.0 to 7.0 | 5.5 to 7.5 |
| Leek | 6.0 to 7.0 | 5.5 to 8.0 |
| Lemon balm | 5.0 to 7.5 | 4.5 to 7.8 |
| Lemongrass | 5.3 to 6.7 | 5.0 to 7.3 |
| Lettuce | 6.0 to 7.0 | 5.5 to 7.5 |
| Lima bean | 5.8 to 6.8 | 5.0 to 7.0 |
| Luffa | 6.5 to 7.5 | 6.5 to 7.5 |
| Malabar spinach | 5.5 to 7.0 | 5.5 to 7.0 |
| Melon | 6.0 to 6.7 | 5.0 to 8.0 |
| Mint | 5.5 to 7.0 | 5.0 to 8.0 |
| Mizuna | 5.8 to 7.5 | 5.5 to 7.5 |
| Molokhia | 4.5 to 8.0 | |
| Mung bean | 5.7 to 6.8 | 5.5 to 7.2 |
| Mustard greens | 5.9 to 6.9 | 5.5 to 7.5 |
| Nasturtium | 5.8 to 7.7 | 5.8 to 7.7 |
| New Zealand spinach | 6.5 to 7.0 | 6.0 to 7.5 |
| Oca | 5.5 to 7.0 | 5.5 to 7.5 |
| Okra | 6.0 to 6.9 | 5.5 to 8.0 |
| Onion | 6.0 to 6.8 | 5.5 to 7.0 |
| Orach | 6.5 to 7.5 | 5.0 to 8.2 |
| Oregano | 6.0 to 7.0 | 6.0 to 8.0 |
| Parsley | 5.7 to 7.0 | 5.0 to 7.5 |
| Parsnip | 5.9 to 7.3 | 5.8 to 7.5 |
| Pea | 5.8 to 6.9 | 5.0 to 7.5 |
| Peanut | 5.5 to 6.5 | 5.0 to 7.5 |
| Potato | 5.0 to 6.0 | 4.5 to 7.5 |
| Pumpkin | 5.8 to 7.5 | 5.5 to 7.5 |
| Purslane | 5.5 to 7.1 | 4.5 to 7.5 |
| Radish | 6.0 to 7.0 | 5.0 to 7.0 |
| Rhubarb | 5.7 to 7.0 | 5.5 to 7.5 |
| Rocket | 6.0 to 7.0 | 6.0 to 8.0 |
| Rosemary | 6.0 to 7.5 | 5.0 to 8.7 |
| Runner bean | 6.0 to 7.0 | 6.0 to 7.5 |
| Sage | 5.0 to 6.5 | 5.0 to 7.5 |
| Salsify | 6.2 to 7.5 | 5.8 to 7.8 |
| Scorzonera | 6.3 to 7.6 | 6.3 to 7.6 |
| Sea kale | 6.5 to 7.5 | 6.0 to 8.0 |
| Shallot | 5.5 to 7.0 | 5.5 to 7.0 |
| Shiso | 6.0 to 7.2 | 5.5 to 7.5 |
| Silverbeet | 6.0 to 6.8 | 6.0 to 7.5 |
| Snake bean | 5.5 to 7.0 | 5.5 to 7.5 |
| Sorrel | 5.5 to 7.0 | 5.5 to 7.0 |
| Spinach | 6.0 to 7.4 | 6.0 to 7.5 |
| Spring onion | 6.0 to 7.0 | 5.5 to 7.4 |
| Strawberry | 5.5 to 6.5 | 5.0 to 8.0 |
| Summer savory | 6.0 to 7.5 | 6.0 to 8.2 |
| Sunflower | 6.0 to 7.2 | 5.5 to 8.0 |
| Swede | 6.0 to 6.8 | 6.0 to 7.4 |
| Sweet corn | 5.8 to 7.0 | 5.0 to 7.5 |
| Sweet marjoram | 6.0 to 7.8 | 6.0 to 8.0 |
| Sweet potato | 5.5 to 6.2 | 5.0 to 7.0 |
| Taro | 5.5 to 6.5 | 5.0 to 7.0 |
| Tarragon | 6.0 to 7.5 | 5.0 to 7.5 |
| Tatsoi | 5.8 to 7.0 | 5.8 to 7.5 |
| Thyme | 5.5 to 7.3 | 5.0 to 8.0 |
| Tomatillo | 6.0 to 7.0 | 5.5 to 7.3 |
| Tomato | 5.8 to 6.8 | 5.0 to 7.5 |
| Tree onion | 6.0 to 8.0 | 6.0 to 8.0 |
| Turmeric | 5.5 to 7.0 | 5.5 to 7.5 |
| Turnip | 6.0 to 6.8 | 5.0 to 7.4 |
| Upland cress | 6.0 to 7.0 | 6.0 to 7.0 |
| Water spinach | 5.2 to 6.5 | 5.2 to 6.5 |
| Watercress | 6.3 to 7.5 | 6.0 to 8.0 |
| Watermelon | 5.8 to 6.7 | 5.5 to 7.0 |
| Winter savory | 6.3 to 7.5 | 6.0 to 7.5 |
| Winter squash | 5.9 to 6.8 | 5.0 to 7.2 |
| Wombok | 6.0 to 7.0 | 5.8 to 7.5 |
| Yacon | 5.8 to 6.5 | 5.8 to 6.5 |
| Yam | 5.5 to 6.5 | 5.0 to 7.0 |
| Zucchini | 5.9 to 6.8 | 5.0 to 7.5 |
How these pH ranges were set
The list under the chart matches the main chart’s crop picker and includes every crop in our Planting Guide that has a pH range. To set each tolerance range, we use the second-lowest and second-highest figures (in water) as the endpoints, which leaves at least two publishers agreeing at each end28,29,30. Those are the limits each crop will tolerate, not the range it prefers. Most crops do best around the middle.
Soil pH for all 124 crops, A to Z
Go deeper: the science behind the chart
You don’t need any of this to grow good veggies. It’s here for when a crop isn’t doing too well and you want to work out why, or you’re just curious about what’s going on in your soil.
The soil pH scale, and what it actually measures
Soil pH describes the acidity or alkalinity of the water held in soil. Its scale goes from 0 to 14, with 7 marking neutral, values under 7 acidic and values over 7 alkaline2.
What the “p” and the “H” stand for
The ‘H’ stands for hydrogen ions. The ‘p’ stands for something… but nobody can agree exactly what. It might be the French puissance, the German Potenz or the Danish potens, all meaning “power”, or it could mean potential. Søren Sørensen (such a cool name), the Danish chemist who came up with the notation in 1909, never wrote it down. ¯\_(ツ)_/¯
Each whole number represents a tenfold difference in acidity. Soil at pH 5 therefore has ten times the acidity of soil at pH 6, and one hundred times the acidity of soil at pH 78,16. So when a garden bed’s pH drops from 6.5 down to 5.5, plants and the soil food web (biology) experience a far larger shift than the small numerical difference suggests.
pH alters the root-zone chemistry. It changes whether nutrients remain dissolved in the water and available for uptake, or attach to clay, iron, aluminium or calcium in the soil and become inaccessible to your plants3,31. Texture and pH also interact, so take a moment to work out your soil texture with our soil type calculator as well.
A periodic table for soil
Tap any tile. Swipe for the whole table.
Tap any tile to see what it does.
- Essential for plants
- Helps some plants, soil life or us
- A worry in soil
- No known role
- Soil life
Hydrogen
The most abundant element in the universe and essential for all life. Water supplies our hydrogen, which is incorporated into every sugar and protein plants make. Hydrogen ions are what soil pH actually measures.
Sources: Marschner 2012 · Epstein and Bloom 2005
Helium
It has no recognised function in either vegetation or soil. As with the other noble gases, helium is unreactive and therefore can’t be used as a building block of life.
Lithium
Lithium has no confirmed job in plants or soil life. Plants can take up small traces, but they don’t need them.
Sources: Marschner 2012 · Epstein and Bloom 2005
Beryllium
Neither plants nor soil organisms are known to use beryllium. Soils contain little of it, while concentrated forms are poisonous.
Sources: National Center for Biotechnology Information · Marschner 2012
Boron
Taken up as boric acid (borate)
Your plants need very little boron. But that small amount helps build and steady cell walls in growing roots and shoots, transport calcium to the plant’s furthest tips, and move sugars from mature leaves to new growth, developing fruit and roots. It also supports healthy pollen, flowering and fruit or seed set. And legumes need enough boron to form root nodules and fix nitrogen.
Classic indicators in vegetables
Short of boron: Damage appears at growing points and in young tissue, killing buds and thickening new leaves making them fragile and misshapen. Familiar disorders include hollow stems in cabbage, broccoli and cauliflower (often accompanied by darkening of florets in the head), turnip and swede with brown heart, celery with cracked stems, and beetroot showing dark patches, cracks and heart rot.
Easily mistaken: Boron-related browning of cauliflower should not be confused with molybdenum whiptail, in which the head remains white.
Too much
There is only a small margin between deficiency and toxicity. With excess boron, yellowing starts at the tips and margins of older leaves, followed by browning that sometimes spreads between the veins, and leaves may fall. High boron can occur naturally in southern Australia’s alkaline, sodic subsoils, while water high in boron or excessive boron fertiliser can also cause it.
Easily mistaken: This pattern can resemble salt burn or magnesium deficiency.36,37,38,39,40,41,42
Feed it with compost plus borax in minute quantities
What to do: use only carefully measured, minute applications of borax or Solubor, never an estimate, and select tolerant crops for alkaline sodic soils.
More about boron
Where it comes from
Real shortages are common on light, sandy or well-limed soils, appearing first in brassicas, beets, celery and strawberries, although the margin between sufficiency and toxicity remains small.
- Borax (tiny amounts)mineral · quick (days to weeks) · no pH changeToxic in excess, especially to young beans. About 1 tablespoon per 100 sq ft (about 9 m²) only where a soil test shows low B, and one dose can last up to 3 years.
- Solubor or sodium boratemineral · quick (days to weeks) · no pH changeSame narrow margin between enough and toxic. Never band near seed.
- Compost and manuresorganic · slow (months to years) · no pH changeSafer, low-dose supply.
Why plants need it
Boron contributes to the structural bonds in cell walls, so rapidly developing tips reveal a lack before slower-growing tissues.
How much plants need
Trace element: tiny amounts, still essential. A micronutrient: about 20 mg/kg of a healthy plant’s dry weight (0.2 mg/kg to 800 mg/kg).
How pH changes it
Most soil boron occurs as uncharged boric acid. It is therefore readily leached from acidic sandy soils under high rainfall, and above roughly pH 7 it attaches to clays and becomes less available. In the strongly alkaline, sodic subsoils found widely across southern Australia, it may instead accumulate to toxic concentrations.
Sources: Victorian Resources Online (archived) · Bryant et al. 2026 · Cartwright et al. 1986 · Jackson 2019 · Ontario Ministry of Agriculture, Food and… · Gatiboni 2022 · Stephens and Zandstra 1983 · UC Statewide IPM Program · Adcock et al. 2007 · Hawkins 2011 · Hart and McNeilan 2000 · Gatiboni and Ozlu 2024
Signs of a shortage
Boron shortage shows on the new growth first, because the plant can’t easily move it out of older leaves.
The same signs can come from pH lock-up, waterlogging or a cold snap, so test your soil before you feed anything.
Carbon
Indispensable to plants. Carbon dioxide from the air provides it, it accounts for nearly half of a plant’s dry weight, and as organic matter it feeds organisms in the soil.
Sources: Marschner 2012 · Epstein and Bloom 2005
Nitrogen
Taken up as nitrate and ammonium
Classic indicators in vegetables
Short of nitrogen: The oldest foliage pales uniformly and then yellows as growth slows. Plants become pale and spindly overall, bearing small leaves and fruit, such as potato plants with yellowing lower foliage and limited fresh growth.
Too much: An oversupply produces dark, soft foliage that breaks easily, with poor fruit set.
Easily mistaken: sulfur deficiency also causes pallor but begins in young foliage, while damaged roots, compacted ground and cold, wet conditions can imitate nitrogen yellowing.39,46,47,48
Feed it with legume cover crops, compost, blood and bone, or chicken manure
What to do: maintain a pH close to 6 to 7 to keep soil organisms active, using compost, manures and legumes as feeds. Limit ammonium fertilisers because they gradually make soil more acidic.
More about nitrogen
Where it comes from
Soil organic matter holds a large reserve of N, although only a little becomes available at once. Vegetable gardens run short of N more often than any other nutrient.
- Compostorganic · slow (months to years) · no pH changeLow and variable N. Mainly a soil conditioner. N becomes available slowly.
- Aged or composted chicken manureorganic · steady (weeks to months) · no pH changeRaw manure burns roots (ammonia) and may carry pathogens and excess salts. Compost or age it, and apply 90-120 days before harvest. About 75% of poultry manure N is available in year one.
- Blood meal (and blood and bone)organic · steady (weeks to months) · no pH changeCan burn plants if over-applied. Australian ‘blood and bone’ is a blend. No extension analysis of it was opened, so its N and P content varies by brand.
- Feather mealorganic · slow (months to years) · no pH changeSlow N release. Pair with a faster source early in a cool season.
- Fish emulsion or liquid fishorganic · quick (days to weeks) · no pH changeSmells. Useful as an early boost when soil is cool and organic N release is slow.
- Legume green manure or cover cropbiological · steady (weeks to months) · no pH changeFixes most N only if grown to bud or flowering and dug or cut in before seed set. N releases quickly after termination, so plant the next crop soon. Rhizobia also need Mo and Co.
Why plants need it
All plant amino acids and proteins contain nitrogen, as does plant DNA, making this the nutrient plants use in the greatest quantities.
How much plants need
Macronutrient: plants use lots. A macronutrient: about 1.5% of a healthy plant’s dry weight (0.5% to 6%).
How pH changes it
Most nitrogen used by plants becomes available when soil microbes decompose organic matter and convert ammonium into nitrate. Strongly acidic conditions greatly slow both these microbes and the nitrogen-fixing rhizobia living in legume roots. At very high pH, nitrogen may escape into the air as ammonia gas.
Sources: Truog 1946 · Potash Development Association (UK) · Gazey · Beegle and Lingenfelter 2014 · Gatiboni 2022 · Hawkins 2011 · Hart and McNeilan 2000 · Gatiboni and Ozlu 2024 · UC Statewide IPM Program · UC Statewide IPM Program · Zitter · Card et al. 2015 · Saliga and Skelly 2013 · Magdoff and Es 2021 · Hu et al. 2021
Signs of a shortage
Nitrogen shortage shows on the older leaves first, because the plant moves it out of old leaves to feed new growth.
The same signs can come from pH lock-up, waterlogging or a cold snap, so test your soil before you feed anything.
Oxygen
Oxygen is essential, sourced by plants from air and water. Roots must also respire using oxygen in the soil, which explains the injury caused by waterlogging.
Sources: Marschner 2012 · Epstein and Bloom 2005
Fluorine
Fluorine has no role in plants. Some phosphate fertilisers bring it in as an impurity, and it gradually collects in the topsoil. Grazing animals swallow it along with soil.
Source: Loganathan et al. 2003
Neon
No function in soil or plants is known for neon, and like other noble gases it reacts very little.
Sodium (sodic soil)
Classic indicators in vegetables
Too much sodium: When water or soil is salty, the edges and tips of older leaves turn yellow and then brown. Elevated sodium also degrades soil structure, a condition called sodicity.
Easily mistaken: Drought stress, boron toxicity and chloride toxicity can all resemble salt burn, making diagnosis difficult.19,41,55,57
Fix it with gypsum and organic matter
What to do: apply gypsum to replace sodium on clay surfaces with calcium, without increasing pH. Incorporate organic matter and avoid digging while the soil is wet.
More about sodium
Why it matters
Its importance here lies in the damage it causes to soil structure. Most garden plants do not require sodium as a nutrient, apart from trace use by a few salt-loving species and some C4 plants.
How pH changes it
A pH reading above roughly 8.5 usually indicates sodium-dominated clay. Wet sodium-affected clay disperses, leaving soil that crusts, hardens and drains poorly, often with salt and boron present as well.
Signs: a surface crust, seedlings having difficulty emerging, waterlogged soil following rain, and puddles whose cloudiness persists.
Sources: Queensland Government · UC Statewide IPM Program · Adcock et al. 2007 · Hawkins 2011 · Maathuis 2014 · Victorian Resources Online (archived) · UC Statewide IPM Program · Rengasamy and Olsson 1991
Magnesium
Classic indicators in vegetables
Short of magnesium: Older foliage develops yellow areas between veins that remain green, occasionally accompanied by bronze or reddish colouring. It is especially visible in Chinese cabbage, tomatoes, cauliflower and beans, and occurs most often in acidic soil or where heavy potassium applications interfere with magnesium uptake.
Easily mistaken: potassium shortage scorches the margins of older leaves instead, and boron toxicity may also be mistaken for a magnesium shortage.39,40,48
Feed it with compost, dolomite or Epsom salts
What to do: where magnesium is deficient, choose dolomite rather than ordinary lime. For a fast foliar spray, use Epsom salts, which leave pH unchanged.
More about magnesium
Where it comes from
Magnesium is generally present in sufficient quantities. Deficiency tends to arise on sandy, light-textured, acidic or severely leached soils, and heavy potassium applications can also prevent roots from absorbing Mg.
- Dolomitemineral · slow (months to years) · raises pHDon’t use on soils already at or above the target pH.
- Epsom salts (magnesium sulfate)mineral · quick (days to weeks) · no pH changeHelps only genuinely Mg-deficient plants. Excess linked to leaf scorch and bitter pit, and washes out as a pollutant.
- Sulfate of potash magnesiamineral · quick (days to weeks) · no pH changeAdds K too. High K can itself cause Mg deficiency.
- Compost and manuresorganic · slow (months to years) · no pH changeModest amounts.
Why plants need it
Every chlorophyll molecule has a magnesium atom at its core, and magnesium activates a greater number of enzymes than any other nutrient.
How much plants need
Secondary nutrient: plants use a fair amount. A secondary macronutrient: about 0.2% of a healthy plant’s dry weight (500 mg/kg to 1%).
How pH changes it
Magnesium behaves much like calcium, leaching from acidic soils and being displaced from clay by aluminium, which additionally prevents roots from absorbing it. Neutral and alkaline soils generally contain ample magnesium.
Too much: when magnesium is high compared with calcium, certain Australian clays may disperse.
Sources: Truog 1946 · Potash Development Association (UK) · Beegle and Lingenfelter 2014 · Gatiboni 2022 · Stephens and Zandstra 1983 · Hawkins 2011 · Gatiboni and Ozlu 2024 · Zitter · Tucker 1985 · Chalker-Scott 2007
Signs of a shortage
Magnesium shortage shows on the older leaves first, because the plant moves it out of old leaves to feed new growth.
The same signs can come from pH lock-up, waterlogging or a cold snap, so test your soil before you feed anything.
Aluminium (toxic)
Classic indicators in vegetables
Aluminium damage: Strongly acidic soil releases soluble aluminium that injures roots, leaving them stubby and thickened at their tips, with few fine branches. Above ground, growth is stunted and foliage remains small and dark green, while stems and veins turn purple, resembling phosphorus deficiency.
Easily mistaken: Because this can be confused with phosphorus deficiency, measure pH before applying phosphorus.15,61,62
Fix it with lime and organic matter
What to do: work in lime so topsoil remains above pH 5.5 when measured in calcium chloride (about 6.1 to 6.7 in water), keep subsoil above 4.8, and add organic matter to bind aluminium.
More about aluminium
Why it matters
Aluminium has no nutritional role in plants, but it matters because it is the chief toxin in acid soils.
How pH changes it
Although aluminium occurs in the clay of every soil, it remains bound until pH (water) falls below roughly 5.5. It then enters solution, stunting and killing root tips so plants cannot obtain water or nutrients, while also fixing phosphorus.
Sources: Gazey · Beegle and Lingenfelter 2014 · Kochian et al. 2004 · Corangamite Catchment Management Authority 2013
Silicon
Most plants do not require silicon, yet it reinforces their stems and foliage. It also improves resistance to pests, diseases and drought in many species, particularly grasses and cereals.
Classic indicators in vegetables
Because silicon is not essential, there is no standard deficiency pattern. Instead, it is a beneficial element that reinforces cell walls and improves plant resistance to stresses including disease.63
Sources: Pilon-Smits et al. 2009 · Kaur et al. 2016
Phosphorus
Taken up as phosphate
Classic indicators in vegetables
Short of phosphorus: Mature plants rarely make it obvious, so look first at seedlings growing slowly and becoming dark green with purple colouration, initially on older foliage and leaf undersides. Purple tomato seedlings and lower leaves with a purple tinge on young sweet corn are textbook examples.
Easily mistaken: purpling brought on by cold, wet spring soil often disappears as temperatures rise, while aluminium toxicity in acidic soil can produce the same stunted purple appearance.39,47,48,65
Feed it with compost and manure, bone meal or rock phosphate
What to do: bring acidic soil towards 6 to 6.5 with lime, add compost and manure, and place phosphorus close to roots on very acidic or limey soils instead of broadcasting it.
More about phosphorus
Where it comes from
Phosphorus is often already abundant in soils that have been gardened for a long time, frequently because manure has been applied for years. Availability, rather than quantity, is the difficulty: P becomes locked away below roughly pH 5.5 and above roughly pH 7.
- Compost and composted manuresorganic · slow (months to years) · no pH changeRepeated heavy manure builds up P well beyond what crops remove. A soil test shows when to stop.
- Bone meal (and blood and bone)organic · steady (weeks to months) · no pH changeLittle use on alkaline soils. Apply only where a soil test shows low P.
- Rock phosphatemineral · slow (months to years) · no pH changeVery slow (several years). Only about 2-3% available phosphate.
- Bat guano (high-P types)organic · slow (months to years) · no pH changeExpensive for the amount of P supplied.
Why plants need it
Phosphorus occurs in both DNA and ATP, the molecule used by all living cells to hold energy and transfer it where it is needed.
How much plants need
Macronutrient: plants use lots. A macronutrient: about 0.2% of a healthy plant’s dry weight (0.15% to 0.5%).
How pH changes it
Two different reactions tie phosphate up: iron and aluminium lock it away below about pH 5.5, and above about 7.5 it reacts with calcium to form insoluble calcium phosphates. Sodic soils explain the other wrinkle: above 8.5, their sodium phosphates dissolve and Truog’s band broadens again, even though these are poor soils to grow in. For phosphorus, modern work gives the soil and the plant just as much influence as pH.
Too much: phosphorus seldom poisons plants, but heavy applications can induce zinc or iron deficiency and damage waterways. Many Australian natives are sensitive to it, including banksias and grevilleas.
Sources: Potash Development Association (UK) · Hartemink and Barrow 2023 · Beegle and Lingenfelter 2014 · Gatiboni 2022 · Hawkins 2011 · Hart and McNeilan 2000 · Gatiboni and Ozlu 2024 · UC Statewide IPM Program · Zitter · Card et al. 2015 · Barrow 2017 · Mississippi State University Extension
Signs of a shortage
Phosphorus shortage shows on the older leaves first, because the plant moves it out of old leaves to feed new growth.
The same signs can come from pH lock-up, waterlogging or a cold snap, so test your soil before you feed anything.
Sulfur
Taken up as sulfate
Classic indicators in vegetables
Short of sulfur: The youngest foliage turns a uniform pale yellow first, then the rest of the plant follows, unlike nitrogen deficiency. Plants grow slowly and their stems remain thin.
Easily mistaken: The lookalike is nitrogen deficiency, which starts yellowing on the oldest leaves rather than at the top of the plant.39
Feed it with Epsom salts, gypsum or compost
What to do: maintain good organic matter levels, or apply gypsum, which won’t alter pH.
More about sulfur
Where it comes from
Provided organic matter levels are reasonable, most garden soils can supply all the S that plants need. In wet seasons, sandy soils can lose S through leaching just as they lose N.
- Gypsum (calcium sulfate)mineral · steady (weeks to months) · no pH changeIts real benefit is on sodic soils. It does not fix acidity or blossom end rot.
- Elemental sulfurmineral · slow (months to years) · lowers pHApply at least 3 months before planting and retest. Only where a soil test says pH is too high.
- Sulfate of ammonia (ammonium sulfate)mineral · quick (days to weeks) · lowers pHAdds N too. Not for organic certification.
- Epsom salts (magnesium sulfate)mineral · quick (days to weeks) · no pH changeOnly where Mg is actually short. Washes through leached soils.
- Compost and manuresorganic · slow (months to years) · no pH changeSupplies S slowly as organic matter breaks down.
Why plants need it
Several amino acids contain sulfur, which means it is needed for proteins as well as for certain helper molecules that allow enzymes to do their work.
How much plants need
Secondary nutrient: plants use a fair amount. A secondary macronutrient: about 0.1% of a healthy plant’s dry weight (0.1% to 1.5%).
How pH changes it
Plants absorb sulfur as sulfate, and because microbes release most of it while breaking down organic matter, sluggish soil life together with leaching restricts supplies in strongly acidic soils. Neutral to alkaline soils generally have plenty.
Sources: Truog 1946 · Potash Development Association (UK) · University of Tennessee Institute of Agriculture · Gatiboni 2022 · Hawkins 2011 · Hart and McNeilan 2000 · Gatiboni and Ozlu 2024 · Spangenberg 2025 · Chalker-Scott and Guggenheim 2018 · Montana State University News Service 2013
Signs of a shortage
Sulfur shortage shows on the new growth first, because the plant can’t easily move it out of older leaves.
The same signs can come from pH lock-up, waterlogging or a cold snap, so test your soil before you feed anything.
Chlorine
Taken up as chloride
Classic indicators in vegetables
Short of chlorine: Garden plants almost never run out. On the rare occasions it happens, foliage wilts, takes on a bronze colour, yellows and eventually dies.
Too much: Excess is much more likely, with saline bore water or recycled water scorching the tips and edges of leaves.35,39,41
Feed it with rain or tap water, though this is seldom necessary
What to do: in most cases, nothing beyond keeping an eye on salt levels.
More about chlorine
Where it comes from
Gardens hardly ever lack chlorine. Chloride moves readily and can be washed out of sandy soil during exceptionally wet seasons, but too much salt is usually the bigger issue.
- Rainfall and irrigation watermineral · quick (days to weeks) · no pH changeCoastal rain and most tap water deliver enough.
- Muriate of potash (potassium chloride)mineral · quick (days to weeks) · no pH changeChloride-sensitive plants and salty soils don’t need more.
- Compost, manures and seaweedorganic · quick (days to weeks) · no pH changeUnverified. Contain soluble salts including chloride.
Why plants need it
Working together with manganese, chloride forms part of the photosynthetic apparatus that splits water.
How much plants need
Trace element: tiny amounts, still essential. A micronutrient: about 100 mg/kg of a healthy plant’s dry weight (10 mg/kg to 8%).
How pH changes it
Because chloride remains in solution across nearly the whole pH range, acidity has little influence over it, and Truog’s chart leaves it out. Rainfall brings it in, particularly near the coast, as do irrigation water and fertilisers.
Sources: Bryant et al. 2026 · Gatiboni 2022 · UC Statewide IPM Program · Hawkins 2011 · Gatiboni and Ozlu 2024 · Montana State University News Service 2013 · Weil and Brady 2017
Argon
Argon has no known function in plants or soil. It comprises about 1% of air but, like the other noble gases, is almost entirely unreactive.
Potassium
Classic indicators in vegetables
Short of potassium: Older foliage is affected first, yellowing before the tips and edges scorch brown, and the leaves may curl. Tomatoes can develop uneven, blotchy ripening and yellow shoulders when fruit potassium is low, even if a soil test suggests there is enough.
Too much: Too much potassium can bring on magnesium or calcium deficiency, while generous potassium applications make blossom-end rot more likely.
Easily mistaken: Magnesium deficiency also begins on older leaves, but it causes yellowing between veins instead of scorched margins.39,47,70,71,72
Feed it with seaweed, compost, wood ash or sulfate of potash
What to do: apply lime to very acidic soils, and use compost, a small amount of wood ash or potassium sulfate where soils are sandy.
More about potassium
Where it comes from
K is already plentiful in many soils, particularly clays and alkaline inland soils. Light sandy soils and heavily leached soils tend to be the exceptions.
- Wood ashmineral · quick (days to weeks) · raises pHNever on soil at pH 7 or above, near blueberries and other acid-lovers, or on scab-prone potatoes. Never ash from treated or painted wood or coal. Concentrated ash can leave harmful salts.
- Sulfate of potash (potassium sulfate)mineral · quick (days to weeks) · no pH changeOrganic standards allow it only where a deficiency is documented.
- Muriate of potash (potassium chloride)mineral · quick (days to weeks) · no pH changeAdds chloride. Avoid where chloride is already high or for chloride-sensitive plants.
- Seaweed or kelporganic · quick (days to weeks) · no pH changeKelp powder is about 1-0-4, so K is modest. Mostly valued for trace elements.
- Compost, manures and grass clippingsorganic · steady (weeks to months) · no pH changeAvoid clippings from herbicide-treated lawns.
- Greensand or rock dustmineral · slow (months to years) · no pH changeRelease is slow and inconsistent. Trial benefits on temperate soils are inconclusive.
Why plants need it
Potassium activates many plant enzymes and, as the main dissolved salt in cells, keeps them plump with water.
How much plants need
Macronutrient: plants use lots. A macronutrient: about 1% of a healthy plant’s dry weight (0.8% to 8%).
How pH changes it
Clay and organic matter hold potassium as a positive ion, but hydrogen and aluminium push it off those exchange sites in acidic soils. It can then wash away, especially from sand, whereas neutral and alkaline soils usually remain well supplied.
Sources: Truog 1946 · Potash Development Association (UK) · Saunders · Gatiboni 2022 · Hawkins 2011 · Hart and McNeilan 2000 · Gatiboni and Ozlu 2024 · UC Statewide IPM Program · Card et al. 2015 · UC Statewide IPM Program · Brust, G · Goldberg · Swoboda et al. 2022
Signs of a shortage
Potassium shortage shows on the older leaves first, because the plant moves it out of old leaves to feed new growth.
The same signs can come from pH lock-up, waterlogging or a cold snap, so test your soil before you feed anything.
Calcium
Classic indicators in vegetables
Short of calcium: Because calcium moves very little once inside a plant, symptoms affect the youngest and most rapidly growing tissues. Familiar examples include blossom-end rot on tomato and capsicum, tipburn in lettuce and within cabbage heads, and celery blackheart. Uneven watering, or too much nitrogen, potassium or salt, explains most cases, rather than inadequate calcium in the soil.
Easily mistaken: Blossom-end rot frequently gets blamed on low soil calcium when allowing plants to dry out between waterings is the actual cause.39,40,72,74,75
Feed it with lime, dolomite and gypsum
What to do: use lime when you want to add calcium and lift pH together, or gypsum if pH should stay unchanged. Regular, even watering helps carry calcium into developing fruit.
More about calcium
Where it comes from
Except in strongly acidic soils, calcium seldom runs short. Most calcium troubles in gardens, including blossom end rot, come down to watering rather than supply.
- Agricultural lime (calcium carbonate)mineral · slow (months to years) · raises pHSoil test first. Apply months before planting and retest after 3-6 months. Avoid hydrated or burnt lime.
- Dolomitemineral · slow (months to years) · raises pHUse where Mg is also low. On high-Mg soils use plain lime.
- Gypsummineral · steady (weeks to months) · no pH changeNot a lime substitute. Ca is rarely the reason for blossom end rot.
- Wood ashmineral · quick (days to weeks) · raises pHSame cautions as for K: never above pH 7 or near acid-lovers.
- Compost, manures and bone mealorganic · slow (months to years) · no pH changeSmall amounts of Ca. Not a pH fix.
Why plants need it
Cell walls are held together by calcium, which also acts as a signal that tells plants when to activate or stop various processes.
How much plants need
Secondary nutrient: plants use a fair amount. A secondary macronutrient: about 0.5% of a healthy plant’s dry weight (0.51% to 6%).
How pH changes it
Leaching removes calcium from acidic soils, leaving hydrogen and aluminium on the clay in its place. Rising pH puts more calcium back onto the clay, and lime-rich soils contain abundant calcium, until sodium displaces it once more in extremely alkaline sodic soils.
Too much: rather than directly poisoning plants, surplus calcium in limey soils binds phosphorus and trace elements, making them less available.
Sources: Truog 1946 · Potash Development Association (UK) · Gazey · Beegle and Lingenfelter 2014 · Saunders · Gatiboni 2022 · Stephens and Zandstra 1983 · Hawkins 2011 · Hart and McNeilan 2000 · Gatiboni and Ozlu 2024 · Chalker-Scott and Guggenheim 2018 · Goldberg · UC Statewide IPM Program · Guan 2022
Signs of a shortage
Calcium shortage shows on the new growth first, because the plant can’t easily move it out of older leaves.
The same signs can come from pH lock-up, waterlogging or a cold snap, so test your soil before you feed anything.
Scandium
No function in plants or soil life is known for this rare metal, which occurs only in traces.
Titanium
No role has been established for titanium. Some research reports slight growth gains from very small doses, and biostimulant products contain it, but it is not recognised as a plant nutrient.
Sources: Lyu et al. 2017 · Pilon-Smits et al. 2009
Vanadium
Crops have not been shown to require vanadium, although certain nitrogen-fixing soil bacteria can substitute it for molybdenum when fixing nitrogen.
Source: Mus et al. 2018
Chromium
Plants have no need for chromium, although it can move from contaminated soil into crops. When it occurs as chromium(VI), it poisons plants and people.
Source: Rai et al. 2019
Manganese
Classic indicators in vegetables
Short of manganese: Young foliage develops a chequered pattern of yellow between the veins, occasionally accompanied by grey or tan spotting. New bean leaves yellow between their veins, beetroot foliage curls and becomes russeted, and onions, lettuce and celery turn yellow and growth stalls. Peas can develop marsh spot, where a brown patch forms inside an outwardly normal seed.
Too much: This is a risk in acidic soil at about pH 5.3 or lower, with waterlogging making it worse. Brown spots and yellow mottling appear near the tips and edges of older leaves, beans get cupped, scorched ‘crinkle leaf’, and potato and tomato foliage turns brittle and crinkled.
Easily mistaken: On young leaves, iron deficiency can look alike, except its green veins are more sharply defined. If soil is alkaline or has been over-limed, consider manganese deficiency. On very acidic soil, suspect manganese toxicity instead.35,39,48,79,80,81
Feed it with seaweed, compost or manganese sulfate
What to do: reduce excess by liming acidic soil and improving its drainage, or spray manganese sulfate onto the foliage where soils are alkaline.
More about manganese
Where it comes from
A shortage is rare, generally appearing in high-pH soils that are well aerated. In acidic soil, excessive Mn is the concern instead.
- Manganese sulfatemineral · quick (days to weeks) · no pH changeOnly where a deficiency is confirmed. Micronutrient over-application can be toxic.
- Compost and manuresorganic · slow (months to years) · no pH changeSmall amounts.
- Seaweed or kelporganic · quick (days to weeks) · no pH changeValued for trace elements but amounts are not quantified in the sources opened.
- Agricultural lime (where acid soil makes Mn toxic)mineral · slow (months to years) · raises pHIn acid soils Mn toxicity (from about pH 5.3 and below) is a bigger risk than shortage.
Why plants need it
During photosynthesis, manganese helps operate the water-splitting machinery that releases the oxygen we breathe.
How much plants need
Trace element: tiny amounts, still essential. A micronutrient: about 50 mg/kg of a healthy plant’s dry weight (10 mg/kg to 600 mg/kg).
How pH changes it
Below roughly pH 5, manganese dissolves readily, and wet, waterlogged conditions increase that solubility. Above about 6.5 it changes into forms that won’t dissolve, which is why deficiencies occur in alkaline, well-aerated or over-limed soils. Truog showed a narrower band at the acidic end. More recent references instead describe availability continuing to increase as pH drops, frequently reaching toxic concentrations, so my chart follows that pattern and turns the band maroon at the acidic end, where excess begins.
Excess becomes a problem from about pH 5.3 downwards, with waterlogging or steaming the soil intensifying it. Sensitive crops include beans, lucerne and brassicas. NSW guidance also points out that white clover can cope with aluminium but not with manganese.
Sources: NSW Department of Primary Industries 2021 · Beegle and Lingenfelter 2014 · Victorian Resources Online (archived) · Bryant et al. 2026 · Gatiboni 2022 · Hawkins 2011 · Gatiboni and Ozlu 2024 · Zitter · Card et al. 2015 · Ontario Ministry of Agriculture, Food and… · Piper 1941 · Robertson and Lucas 1981
Signs of a shortage
Manganese shortage shows on the new growth first, because the plant can’t easily move it out of older leaves.
The same signs can come from pH lock-up, waterlogging or a cold snap, so test your soil before you feed anything.
Iron
Classic indicators in vegetables
Short of iron: The youngest leaves become yellow, sometimes nearly white, between veins that remain sharply green, and dead patches may develop at their tips. This is lime-induced chlorosis on alkaline or lime-rich soil: iron is abundant in the soil but unavailable to the plant.
Easily mistaken: A manganese shortage can also yellow young foliage, though its pattern is a softer chequerboard. In acidic soil, very high manganese levels can themselves bring on iron chlorosis.39,47,48,81,82
Feed it with iron chelate, iron sulfate or compost
What to do: where soil is alkaline, make the root zone more acidic, apply iron chelate or iron sulfate, choose plants that tolerate the conditions, and avoid excessive liming.
More about iron
Where it comes from
Iron itself is nearly always abundant in soil. When leaves yellow between their veins in alkaline conditions, high pH is stopping plants from accessing it rather than the soil being short of iron.
- Iron chelate (EDDHA type for alkaline soil)mineral · quick (days to weeks) · no pH changeA patch, not a cure. Effect lasts from part of a season to two years.
- Iron sulfatemineral · steady (weeks to months) · lowers pHUseful only on soils without free lime. Can stain paving.
- Foliar iron spray (sulfate or chelate)mineral · quick (days to weeks) · no pH changeGreens up in days but is spotty and temporary. Repeat as needed.
- Elemental sulfur (to lower pH)mineral · slow (months to years) · lowers pHSlow, and does little on soils with free lime.
- Compostorganic · slow (months to years) · no pH changeSupportive rather than a cure for lime-induced chlorosis.
Why plants need it
Several enzymes are activated by iron, and it also forms part of the proteins that transfer energy during both photosynthesis and respiration.
How much plants need
Trace element: tiny amounts, still essential. A micronutrient: about 100 mg/kg of a healthy plant’s dry weight (20 mg/kg to 600 mg/kg).
How pH changes it
Acidic conditions keep iron readily soluble, but increasing pH converts it to oxides that won’t dissolve, with solubility falling by approximately a thousandfold whenever pH rises by one unit. This explains why plants growing in alkaline or limey soil can lack iron even though the soil contains plenty.
Too much: excess iron is chiefly a concern in very acidic, waterlogged soils, including flooded rice paddies.
Sources: Bryant et al. 2026 · Gatiboni 2022 · Hawkins 2011 · Hart and McNeilan 2000 · Gatiboni and Ozlu 2024 · UC Statewide IPM Program · Zitter · Robertson and Lucas 1981 · Card et al. 2015 · Tsai and Schmidt 2020
Signs of a shortage
Iron shortage shows on the new growth first, because the plant can’t easily move it out of older leaves.
The same signs can come from pH lock-up, waterlogging or a cold snap, so test your soil before you feed anything.
Cobalt
Classic indicators in vegetables
Short of cobalt: Vegetables have no direct requirement for it, but nitrogen-fixing bacteria living in legume root nodules do. Beans and peas therefore look starved of nitrogen when cobalt is lacking.
Too much: High concentrations make foliage pale, discolour the veins and cause leaves to fall, and cobalt can also bring on iron deficiency.
Easily mistaken: A cobalt shortage in legumes looks just like a nitrogen shortage.52
Feed it with compost and well-nodulated legumes
What to do: gardens generally need no action.
More about cobalt
Where it comes from
For most plants, cobalt is beneficial without being essential. Some areas of South Australia have low Co levels, but it is seldom something gardens need to add.
- Compost and manuresorganic · slow (months to years) · no pH changeIt’s not clear these supply much cobalt.
- Cobalt sulfate (trace, for legumes)mineral · quick (days to weeks) · no pH changeAllowed under organic rules for documented deficiency. Toxic in excess and can induce iron deficiency.
- Good nodulation in legumesbiological · steady (weeks to months) · no pH changeBeneficial, not essential, for most plants. Matters mainly for nitrogen fixation.
Why plants need it
Cobalt is unnecessary for the plant itself, yet the bacteria fixing nitrogen inside legume nodules require it at roughly 0.1 mg/kg.
How much plants need
Not needed by plants themselves: legume nodules use it. Not essential for plants themselves. The nitrogen-fixing bacteria in legume nodules need about 0.1 mg/kg.
How pH changes it
Some South Australian soils are low in cobalt. More broadly, higher pH usually means less cobalt is available.
Sources: Hawkins 2011 · Gatiboni and Ozlu 2024 · Hu et al. 2021 · Weil and Brady 2017
Nickel
Classic indicators in vegetables
Short of nickel: No deficiency has been recorded in home gardens, and plants need so little that it has mainly been demonstrated in experiments, including barley grown without nickel.35,39,84
Feed it with compost, although this is seldom necessary
What to do: usually nothing, but avoid acidifying contaminated ground.
More about nickel
Where it comes from
Nickel is essential, but only in trace amounts, and it isn’t a practical garden concern. I found no recorded deficiency in common crops.
- Compost and manuresorganic · slow (months to years) · no pH changeIt’s not clear these supply much nickel.
- Nickel sulfate foliar spray (pecans only)mineral · quick (days to weeks) · no pH changeSpecialist use for ‘mouse-ear’ in pecans on alkaline or calcareous soils. Seen only in search results, not opened. High soil Ni is itself harmful.
Why plants need it
Urease contains nickel, and this enzyme converts urea into ammonium, allowing plants to make use of urea’s nitrogen.
How much plants need
Trace element: tiny amounts, still essential. A micronutrient: about 0.05 mg/kg of a healthy plant’s dry weight (0.05 mg/kg to 5 mg/kg).
How pH changes it
Nickel behaves similarly to zinc: it dissolves more readily under acidic conditions and becomes more firmly held as the soil pH increases.
Too much: excess occurs more often than deficiency, either in acidic soil formed on serpentine rock or where ground is contaminated.
Sources: Bryant et al. 2026 · Gatiboni 2022 · Hawkins 2011 · Weil and Brady 2017 · Brown et al. 1987
Copper
Classic indicators in vegetables
Short of copper: Peaty or highly organic ground and leached sands are the usual places to see it. Watch the newest growth for small, pale, wilting leaves, sometimes with a bluish-green cast. Onions get dying leaf tips and thin, pale yellow bulb skins, lettuce goes limp with bleached stems, and carrot roots turn pale.
Too much: Sandy soils are especially prone to trouble after repeated applications of Bordeaux mixture or other copper fungicides, which can leave copper at toxic levels for many years.35,39,85,86
Feed it with compost, seaweed and copper sulfate
What to do: On deficient sands, keep copper sulfate rates very low, and don’t keep putting copper fungicides on the same ground.
More about copper
Where it comes from
Copper deficiency seldom occurs in gardens, and organic matter binds the element strongly. An excess is the more likely problem, such as after many years of copper sprays.
- Copper sulfatemineral · quick (days to weeks) · no pH changeCopper accumulates and excess is toxic. Never apply without a confirmed deficiency.
- Compost and manuresorganic · slow (months to years) · no pH changeUsually supplies enough.
- Seaweed or kelporganic · quick (days to weeks) · no pH changeAmounts not quantified in sources opened.
Why plants need it
Plants use copper-containing enzymes both to photosynthesise and to construct strong cell walls.
How much plants need
Trace element: tiny amounts, still essential. A micronutrient: about 6 mg/kg of a healthy plant’s dry weight (2 mg/kg to 50 mg/kg).
How pH changes it
Of all the trace elements, copper has the strongest affinity for organic matter. That makes peat and other exceptionally organic-rich soils classic deficiency sites, while adding lime causes clay and organic matter to bind it even more firmly. Availability does decline with rising pH, though much more gradually than zinc’s, and naturally low copper can also occur on leached acidic sands. Truog combined copper and zinc in a single band, so I’ve used those sources to separate his band for this chart.
Sources: Truog 1946 · Potash Development Association (UK) · Bryant et al. 2026 · Gatiboni 2022 · Hawkins 2011 · Gatiboni and Ozlu 2024 · Schulte and Kelling 1999 · Ontario Ministry of Agriculture, Food and… · Schulte and Kelling 1999 · Jeffery and Uren 1983
Signs of a shortage
Copper shortage shows on the new growth first, because the plant can’t easily move it out of older leaves.
The same signs can come from pH lock-up, waterlogging or a cold snap, so test your soil before you feed anything.
Zinc
Classic indicators in vegetables
Short of zinc: Look at the young leaves first: short internodes crowd them into rosettes, they stay small and narrow (‘little leaf’), and yellowing appears between the veins. Snap beans also yellow between their veins, sweet corn puts out new leaves banded pale to white, and onions stay stunted with twisted, yellow-striped leaves.
Too much: It takes very high soil concentrations to cause toxicity, usually because of contamination rather than ordinary gardening.
Easily mistaken: Manganese yellowing has a different pattern from the mottling zinc causes on bean leaves, and heavy phosphorus fertiliser can bring on a zinc shortage.39,90,91
Feed it with compost, seaweed and zinc sulfate
What to do: use zinc sulfate on the soil or as a leaf spray, bring pH towards 6 to 6.5, and add compost.
More about zinc
Where it comes from
Garden soils with plenty of organic matter generally contain enough zinc. Shortages tend to occur instead on sandy, high-pH soils that have little organic matter.
- Zinc sulfatemineral · quick (days to weeks) · no pH changeTiny amounts only. Foliar sprays can burn young leaves.
- Zinc chelatemineral · quick (days to weeks) · no pH changeWorks well but costs more.
- Compost and manuresorganic · slow (months to years) · no pH changeUsually enough for gardens. Repeated heavy manure can build up metals.
- Seaweed or kelporganic · quick (days to weeks) · no pH changeAmounts not quantified in sources opened.
Why plants need it
Many enzymes contain zinc, while others need it to switch on.
How much plants need
Trace element: tiny amounts, still essential. A micronutrient: about 20 mg/kg of a healthy plant’s dry weight (10 mg/kg to 250 mg/kg).
How pH changes it
Acidic conditions dissolve zinc more readily, but its availability falls quickly as pH climbs because clays, oxides and carbonates bind it strongly. Most shortages therefore appear above roughly pH 6.5, particularly on alkaline sands and in soil that has received heavy phosphorus fertiliser applications.
Sources: Truog 1946 · Potash Development Association (UK) · Bryant et al. 2026 · Gatiboni 2022 · Hawkins 2011 · Gatiboni and Ozlu 2024 · Card et al. 2015 · Jeffery and Uren 1983 · Schulte, E · Ontario Ministry of Agriculture, Food and… · Schulte, E
Signs of a shortage
Zinc shortage shows on the new growth first, because the plant can’t easily move it out of older leaves.
The same signs can come from pH lock-up, waterlogging or a cold snap, so test your soil before you feed anything.
Gallium
Plants and soil organisms have no known use for gallium, which occurs only in trace amounts.
Germanium
Although germanium is chemically similar to silicon, it occurs only in traces and has no known function in plants or soil organisms.
Arsenic
Arsenic has no plant function and is toxic to both plants and people. Where soil is contaminated, it can accumulate and move into crops. Some soil microbes can breathe arsenate, which affects how easily arsenic moves into water and crops.
Sources: Rai et al. 2019 · Stolz and Oremland 1999
Selenium
Plants don’t require selenium, although it can help some of them withstand stress. People and livestock do need it, so crops from selenium-poor soils can leave their diets short of this element. Bacteria are another story. About a fifth of the species sequenced need selenium for some of their enzymes.
Sources: Pilon-Smits et al. 2009 · White and Broadley 2009 · Zhang et al. 2006
Bromine
Bromine has no established function in plants, but bromide behaves like chloride and plants take up traces of it. Animals need a little bromine to build collagen IV, which earthworms and nematodes have too, although so far that has only been tested in fruit flies.
Sources: McCall et al. 2014 · Marschner 2012
Krypton
Krypton has no known function in soil or plants and, like the other noble gases, undergoes almost no chemical reactions.
Rubidium
Rubidium has no established function, but plants absorb it together with potassium because the two elements are very similar.
Source: Marschner 2012
Strontium
Plants absorb strontium alongside calcium, which it closely resembles, but it has no established role.
Source: Marschner 2012
Yttrium
This rare metal occurs only in traces, and no use for yttrium has been found in plants or soil life.
Zirconium
No function in plants or soil life is known for zirconium, whose minerals are so stable that they scarcely dissolve in soil.
Niobium
A rare metal present only in traces, niobium has no known function in plants or soil organisms.
Molybdenum
Taken up as molybdate
Classic indicators in vegetables
Short of molybdenum: Acid ground below about pH 6 is the most likely setting, which makes this shortage unusual. Pale, mottled foliage can look like nitrogen deficiency at first. In cauliflower and broccoli, the telltale disorder is whiptail: normal leaf blades don’t develop, leaving narrow, twisted straps with upturned edges that look scorched.
Easily mistaken: Those first signs are easy to mistake for nitrogen deficiency. Liming acid soil usually corrects the problem.39,40,97
Feed it with lime or dolomite, and sodium molybdate
What to do: begin by liming acid soil, which usually resolves it. Failing that, use sodium molybdate at tiny rates, or treat legume seed with it.
More about molybdenum
Where it comes from
Only minute quantities are required, and a genuine absence from soil is rare. When a shortage such as cauliflower whiptail does occur, acid soil has nearly always made the molybdenum unavailable.
- Lime or dolomite (to raise pH)mineral · slow (months to years) · raises pHTakes several months. If lime is not otherwise needed, a molybdate dose is quicker.
- Sodium molybdate (or ammonium molybdate)mineral · quick (days to weeks) · no pH changeMinute rates: 40 g in 50 L water per 10 m² of seedbed, 1-2 weeks before transplanting brassicas or tomatoes. Excess Mo in forage can harm grazing livestock.
- Compost and manuresorganic · slow (months to years) · no pH changeManure and seed often carry enough Mo.
Why plants need it
Molybdenum is part of two key enzymes: nitrogenase fixes nitrogen from the air, while nitrate reductase converts nitrate into something plants can build with.
How much plants need
Trace element: tiny amounts, still essential. A micronutrient: about 0.1 mg/kg of a healthy plant’s dry weight (0.1 mg/kg to 10 mg/kg).
How pH changes it
Molybdenum breaks the pattern: it is the only trace element whose availability increases with pH, since iron and aluminium oxides grip it tightly in acidic soils. Nitrogen fixation in legumes depends on it. I’ve based its band on Truog’s description, since the PDA redrawing leaves it out.
Too much: excessive amounts in pasture can leave grazing animals short of copper.
Sources: Truog 1946 · Beegle and Lingenfelter 2014 · Bryant et al. 2026 · Gatiboni 2022 · Stephens and Zandstra 1983 · Hawkins 2011 · Weir 1984 · Ontario Ministry of Agriculture, Food and…
Technetium
Technetium has no role whatsoever. With no stable form, it is radioactive and almost none occurs naturally.
Ruthenium
Ruthenium is a rare precious metal with no known function in plants or soil life.
Rhodium
Plants and soil organisms have no known use for rhodium, a rare precious metal.
Palladium
A rare precious metal, palladium has no known role in either plants or soil life.
Silver
Silver has no known plant role. Even small amounts harm the soil microbes that fix and cycle nitrogen, although natural levels in soil are extremely low.
Sources: National Center for Biotechnology Information · McGee 2020
Cadmium
Cadmium serves no purpose in plants and is toxic to people. It is carried as an impurity by some phosphate fertilisers, builds up in topsoil and is taken up by crops.
Sources: Loganathan et al. 2003 · Rai et al. 2019
Indium
Indium occurs only in trace amounts and has no known function in plants or soil life.
Tin
Plants and soil organisms aren’t known to use tin for anything.
Antimony
Antimony has no known plant role. It is toxic like its neighbour arsenic, but only contaminated soils make it a concern. At old mine sites, at least one soil bacterium can breathe antimonate in place of oxygen.
Sources: Abin and Hollibaugh 2013 · National Center for Biotechnology Information
Tellurium
Soil holds very little tellurium, and no plant uses it. A few lake-mud bacteria can breathe it, and many soil microbes simply lock it away to protect themselves.
Sources: Baesman et al. 2007 · National Center for Biotechnology Information
Iodine
Iodine is not an established plant nutrient, although recent studies suggest that very small doses might help some plants grow. People need it, and food grown in iodine-poor soil is consequently low in iodine.
Sources: Kiferle et al. 2021 · Nascimento et al. 2022 · White and Broadley 2009
Xenon
Xenon has no known function in plants or soil and, like every noble gas, reacts with almost nothing.
Soil bacteria
Bacteria recycle organic matter into nutrients plants can use, but their activity slows markedly in acidic soil.
More about soil bacteria
Why it matters
The pH bacteria experience determines how fast the whole soil kitchen runs, because they do much of the work of returning organic matter to a form plants can use. A teaspoon of healthy farm soil, about a gram, holds 100 million to a billion bacteria.
How pH changes it
In a long-term field trial spanning pH 4 to 8.3, bacteria at the alkaline end grew about five times faster than those at pH 4, with growth fastest above approximately pH 7. Liming acidic soil shifts the balance of soil life towards bacteria.
Sources: Rousk et al. 2009 · Ingham 1999

Actinomycetes
Actinomycetes are bacteria that grow as fine, branching threads, much like fungi. They thrive in neutral to alkaline soil, and so does common potato scab, which is caused by one of them.
What to do: if scab spots your potatoes, keep that bed at about pH 5.0 to 5.2, and don’t lime it or put wood ash or fresh manure on it. Keep the soil moist for the 2 to 6 weeks after the tubers start forming, and grow resistant varieties if your soil sits near neutral.
More about actinomycetes
Why it matters
They break down the tough stuff, like the chitin in insect shells and the cellulose in straw, and they’re what gives freshly dug soil that lovely earthy smell. There are around 10,000 of them in every milligram of soil, though the counts swing a thousandfold depending on how they’re done.
Actinomycetes grow as fine branching threads, a lot like fungi, but they’re actually bacteria. Streptomyces is the best-known group, and its relatives make many of the antibiotics we rely on.
How pH changes it
They do best in neutral to alkaline soil and fade as it gets more acid. Across 88 soils, from acid forests to deserts, their share of the bacteria rose with pH, and in acid soil the fungi take over the job of breaking down those tough materials. Potato growers know this one well, because common scab is a Streptomyces. It’s held right back at pH 5.2 or lower, but it can be a real problem anywhere from about 5.5 to 7.5. There’s an acid-loving scab too, which grows down to pH 4, so a low pH isn’t a guarantee.
Sources: Ingham 1999 · Silva et al. 2022 · Lauber et al. 2009 · McGrath 2021 · Hammerschmidt and Lacy 1990 · University of Maryland Extension 2021

Nitrifying bacteria
Nitrifying bacteria convert ammonium to nitrate, but they stall below about pH 5.5.
Help it with lime
What to do: apply lime to acidic soils and avoid heavy applications of ammonium fertilisers.
More about nitrifying bacteria
Why it matters
By converting ammonium into nitrate, these bacteria produce the form of nitrogen that most vegetables absorb most readily. A gram of well-farmed soil holds roughly a million to tens of millions of ammonia-oxidising bacteria, depending on how they are counted.
Nitrification has two steps, and different microbes handle them. Bacteria including Nitrosomonas and Nitrosospira convert ammonium to nitrite, after which Nitrobacter and Nitrospira convert that nitrite to nitrate. Archaea, a distinct microbial group that tolerates acidic soil better than these bacteria, also carry out some of this work. Then, in 2015, researchers identified Nitrospira capable of completing both steps alone.
How pH changes it
Strong acidity below about pH 5.5 slows them sharply, so ammonium accumulates rather than being converted.
Sources: Beegle and Lingenfelter 2014 · Weil and Brady 2017 · Hermansson and Lindgren 2001 · Zhang et al. 2012 · Gubry-Rangin et al. 2011 · Daims et al. 2015 · Kessel et al. 2015

Rhizobia
Legumes rely on rhizobia to harvest nitrogen from the air, but these bacteria don’t cope well below about pH 6.
Help it with lime and the right inoculant
What to do: add lime, inoculate the seed with a strain matched to that legume, and grow acid-tolerant legumes where the ground is acid.
More about rhizobia
Why it matters
By drawing nitrogen from the air, rhizobia enable peas, beans and clover to feed themselves and the crop that follows. Where legumes grow regularly, more than 1,000 rhizobia in a gram of topsoil is common, and they can multiply to 10,000 a gram once legume roots get going. Even then they’re less than one in a thousand of the soil’s bacteria, but right around a growing legume root they can pass 1,000,000 a gram.
The word rhizobia describes a function rather than a taxonomic family. Rhizobium, Bradyrhizobium, Sinorhizobium and Mesorhizobium belong to several different families, while some bacteria that partner with beans come from yet another branch. This is why inoculants are crop-specific: a strain suited to peas will not form nodules on soybeans or lupins.
How pH changes it
Acidic soil below about pH 6 makes survival difficult for the bacteria that allow legumes to fix nitrogen, and they form fewer nodules there. Aluminium, together with low levels of molybdenum and calcium, compounds the problem. Some strains associated with lupins and serradella tolerate acidity well, whereas lucerne and medic strains do not.
Sources: Gazey · Beegle and Lingenfelter 2014 · Farquharson et al. 2022 · Peix et al. 2015 · Moulin et al. 2001 · Talbi et al. 2010

Ammonia-oxidising archaea
Archaea start nitrification in acid soil, where the nitrifying bacteria stall.
More about ammonia-oxidising archaea
Why it matters
In many soils they’re the main ammonia oxidisers, and one study of 12 soils found up to 3,000 of their genes for every one from the bacteria doing the same job. Counted by their genes, acid soil holds something like 10,000 of them in every milligram.
Archaea look a lot like bacteria under the microscope, but they’re a separate branch of life altogether. Some of them do the same first step of nitrification as Nitrosomonas, turning ammonium into nitrite.
How pH changes it
As soil gets more acid, the nitrifying bacteria fall away and the archaea take over. Below about pH 4.5 they do nearly all of it, and one archaeon grows only between pH 4 and 5.5. But they aren’t acid specialists as a group, and other kinds live happily in neutral and alkaline soil, which is why their band on the chart stays broad and nearly flat.
What it means for you: acid soil slows nitrification without stopping it, so ammonium fertiliser and manure still turn into nitrate, which can wash out of the root zone. Liming still helps, mostly because the bacterial nitrifiers and most veggies prefer it.
Sources: Zhang et al. 2012 · Gubry-Rangin et al. 2011 · Leininger et al. 2006 · Nicol et al. 2008 · Lehtovirta-Morley et al. 2011 · Stempfhuber et al. 2015

Soil fungi
Fungi decompose resistant materials such as wood and dominate in acidic soil.
More about soil fungi
Why it matters
Fungi decompose resistant materials including wood and leaf litter, while many form root partnerships that supply plants with water and phosphorus. That same teaspoon of soil holds several metres of fungal threads under crops, and tens to hundreds of metres under grassland.
How pH changes it
A long-term field trial spanning pH 4 to 8.3 found bacteria growing fastest at the alkaline end, but fungi showed the opposite pattern. At pH 4, fungal growth was about five times faster than at 8.3, partly because acid soil brings less competition from bacteria. Fungi dominate acid forest soils, and acid-loving plants such as blueberries depend on fungal partners.
Sources: Rousk et al. 2009 · Ingham 1999

Arbuscular mycorrhizal fungi
Mycorrhizal fungi reach out from roots for phosphorus and water, but strongly acid soil, below about pH 5, cuts them back.
Help them with living roots, less digging, less phosphorus
What to do: keep something growing in the bed, because long bare fallows starve them, and go easy on phosphorus fertiliser, which cut their numbers by about a third on average across field trials. Dig less, skip broad-spectrum fungicides, and follow brassicas or beets with a crop that does host them.
More about arbuscular mycorrhizal fungi
Why it matters
Their threads run out from the root into soil the roots can’t reach, bringing back phosphorus, zinc and water, and the plant pays them in sugar. A gram of cropped soil holds somewhere between 3 and 30 metres of fungal threads, and in farm soil most of those belong to these fungi.
These are the fungi that live partly inside plant roots. The “arbuscular” in their name comes from the tiny branched, tree-like structures they build inside root cells, which is where plant and fungus swap goods. Most veggies partner with them, but the brassicas and the beet family (broccoli, mustard, spinach, beetroot) don’t, and neither do lupins or canola.
How pH changes it
Strongly acid soil, below about pH 5, is hard on them. The aluminium that dissolves at that pH seems to be the main problem, so roots carry fewer of them, fewer kinds survive, and some barely grow threads into the soil at all. I couldn’t find good measurements on the alkaline side, so the taper on the chart above pH 8 is my best estimate rather than a measured line.
Sources: Ingham 1999 · Smith et al. · Shen et al. 2016 · Göransson et al. 2008 · Kawahara et al. 2016 · Aarle et al. 2002 · Treseder 2004

Earthworms
Earthworms create tunnels and blend the soil as they move, though strongly acidic conditions make them scarce.
Help them with lime and organic matter
What to do: lime acidic soil, and maintain a steady supply of compost, mulch and manure so the worms have enough food.
More about earthworms
Why it matters
Earthworms pull leaves and mulch below ground, blending the soil and opening channels for air, water and roots. Those tunnels improve water infiltration and allow roots to penetrate more deeply. Healthy farm soil carries about 50 to 300 earthworms a square metre, and good grassland up to about 500.
How pH changes it
Acidic conditions don’t suit earthworms. Their numbers decline below pH 4.5 when soil pH is measured in calcium chloride, as labs do, which corresponds to roughly 5.1 to 5.7 on this chart. South Australian research found that worm numbers doubled as that pH increased from 4.1 to 6.7. And in a ten-year trial on very acidic ground in southern NSW, limed plots supported about three times as many common introduced worms as plots without lime. They also fare poorly in strongly alkaline conditions.
Sources: Ingham 1999 · NSW Department of Primary Industries and Regional… · Hirth et al. 2009
What your fertilisers do to soil pH
Show the fertiliser table
This view flips the information around, beginning with the inputs you might already have in the garden shed. Select a nutrient in the grid to open its entry, and read the final column before spreading anything: lime, dolomite and wood ash raise pH, whereas sulfur lowers it.
| Input | pH | N | P | K | S | Ca | Mg | Fe | Mn | Zn | Cu | B | Mo |
|---|---|---|---|---|---|---|---|---|---|---|---|---|---|
| Compost A little of every nutrient, released slowly. Its real value is organic matter and soil life, so treat it as a soil builder, not the cure for one shortage. | moderates Organic matter steadies pH, so soil with plenty of compost swings less either way. | Nitrogen (a little) | Phosphorus (a little) | Potassium (a little) | Sulfur (a little) | Calcium (a little) | Magnesium (a little) | Iron (a little) | Manganese (a little) | Zinc (a little) | Copper (a little) | Boron (a little) | |
| Manures Good for nitrogen, phosphorus and potassium, with a little of the rest. Poultry manure is far stronger than cow or horse manure, so use less of it. | alkalises A subtle effect. Manures nudge acid soil up a little, and laying-hen manure carries enough lime to act like a weak one. | Nitrogen | Phosphorus | Potassium | Sulfur (a little) | Calcium (a little) | Magnesium (a little) | Iron (a little) | Manganese (a little) | Zinc (a little) | Copper (a little) | Boron (a little) | Molybdenum (a little) |
| Blood and bone A slow feed of nitrogen, phosphorus and calcium. It has almost no potassium unless the bag says potash has been added. | no change | Nitrogen | Phosphorus | Potassium (a little) | Sulfur (a little) | Calcium | |||||||
| Seaweed or kelp A modest potassium source with a trace of nearly everything else. Liquid seaweed works more as a plant tonic than a fertiliser. | no change | Nitrogen (a little) | Phosphorus (a little) | Potassium | Sulfur (a little) | Calcium (a little) | Magnesium (a little) | Iron (a little) | Manganese (a little) | Zinc (a little) | Copper (a little) | Boron (a little) | Molybdenum (a little) |
| Legume green manure Peas, beans or clover grown to be dug in. They add nitrogen taken from the air. Their other nutrients came from your soil and just go back into it. | no change | Nitrogen | |||||||||||
| Wood ash Ash from untreated wood. Good for potassium and calcium, and it raises pH like a weak lime, so keep it off soil that is already alkaline. | alkalises | Phosphorus (a little) | Potassium | Sulfur (a little) | Calcium | Magnesium (a little) | Zinc (a little) | Copper (a little) | Boron (a little) | Molybdenum (a little) | |||
| Agricultural lime Ground limestone (calcium carbonate). The standard way to raise the pH of acid soil, and it adds calcium as it goes. | alkalises | Calcium | Molybdenum: Adds no molybdenum itself. Raising the pH frees up molybdenum that is already in your soil. | ||||||||||
| Dolomite Lime with magnesium in it. Choose it over ordinary lime only where your soil is short of magnesium. | alkalises | Calcium | Magnesium | Molybdenum: Adds no molybdenum itself. Raising the pH frees up molybdenum that is already in your soil. | |||||||||
| Gypsum Calcium sulfate. Adds calcium and sulfur without moving pH. Mostly used to loosen sodic clay that sets hard and crusts. | no change | Sulfur | Calcium | ||||||||||
| Epsom salts Magnesium sulfate. A quick fix for a real magnesium shortage, often as a leaf spray. It does nothing for plants that already have enough. | no change | Sulfur | Magnesium | ||||||||||
| Elemental sulfur Yellow sulfur powder. Soil bacteria slowly turn it into acid, so people use it to bring pH down for acid lovers like blueberries. | acidifies | Sulfur | Iron: Adds no iron itself. Lowering the pH frees up iron that is already in your soil, though not where the soil holds free lime. | ||||||||||
| Sulfate of potash Potassium sulfate. A concentrated potassium feed, used where fruit and flowers are poor on sandy or heavily cropped soil. | no change | Potassium | Sulfur | ||||||||||
| Rock phosphate Ground phosphate rock. Rich in phosphorus and calcium, but it lets go of them very slowly, and hardly at all in neutral or alkaline soil. | no change | Phosphorus | Calcium | ||||||||||
| Iron chelate or sulfate Iron in forms plants can take up. People use them when new leaves turn yellow between green veins on alkaline soil, as citrus and blueberries often do. The chelate keeps working at high pH. The sulfate also acidifies a little. | acidifies (the sulfate) Iron sulfate acidifies a little. Iron chelate does not change pH. | Sulfur (a little) | Iron | ||||||||||
| Trace element sulfates Manganese, zinc and copper sulfate. Tiny doses to fix a shortage that a soil test or the leaves have shown, mostly on alkaline or sandy soil. Easy to overdo, so measure. | no change | Sulfur (a little) | Manganese | Zinc | Copper | ||||||||
| Borax A source of boron. A pinch fixes hollow stems in brassicas and black heart in beetroot. The gap between enough and too much is narrow, so never guess the dose. | no change | Boron | |||||||||||
| Sodium molybdate A source of molybdenum. A tiny amount cures whiptail in cauliflower and helps legumes fix nitrogen on acid soil. Liming often does the same job. | no change | Molybdenum |
Your soil type and pH
Acid, alkaline and organic soils don’t all fail in the same way, so open the section that fits your patch.
Acid soils in Australia, and the aluminium problem
No other soil problem is as widespread in Australia as acidity. Around 50 million hectares, about half of Australia’s agricultural land, have topsoil measuring pH 5.5 or less in calcium chloride, as Australian labs do, which is approximately 6.1 to 6.7 on this chart’s scale, and 12 to 24 million hectares have strongly acid subsoils15. NSW has the problem across more than half of its intensively farmed land8.
Left to itself, soil acidifies slowly where rainfall is high. On gardens and farms, the process goes faster as nitrate leaches following ammonium fertiliser use and legume growth, and as produce, hay and prunings are taken away year after year8,15.
Below about pH 5.5 (in water), the real damage comes from aluminium, which dissolves and damages root tips, so plants sit stunted15,61. Manganese can become toxic under the same conditions, while phosphorus, calcium, magnesium and molybdenum all become harder for plants to get16,35.
So the targets used by Australian agencies are topsoil above 5.5 (CaCl₂), with subsoil above 4.814,15. You can also build organic matter, adding humus that binds aluminium and buffers the swings. On acid ground, making good compost is one of the most useful jobs you can take on.
Where a site has a past, acidity can release metals you’d rather not have in your food. Old spud paddocks, vineyards and orchards can retain copper after years of spraying, and runoff from galvanised sheds, tanks and roofs can add zinc141. In pockets of Tasmania, Queensland and NSW, soils over serpentine, a greenish stone with a waxy look, may be rich in nickel142. Almost any contaminant could linger on old industrial or mining land. For city gardeners, cadmium deserves special attention, since increasing acidity makes plants absorb more of it143. If your ground has that sort of history, get a soil test for heavy metals before planting and use lime to hold pH near 6.5, among the easiest options for keeping those metals in the soil rather than in your veggies143.
Alkaline and sodic soils
Alkaline and sodic soils extend across western Victoria, the Murray Basin and vast tracts of the drier inland. Sodic soils cover roughly 28% of the continent, and the figure for Queensland is about 45%19,56.
Once soil is alkaline (above about 7.5), trace elements become the main problem. Boron, copper, iron, manganese and zinc are held tightly, calcium ties up phosphorus, and the foliage yellows between its veins16,35. Many alkaline subsoils across southern Australia also contain boron and salt at root-damaging levels36,42.
A pH above about 8.5 strongly suggests sodicity, with sodium causing the clay to slump, crust and drain poorly19,56. Gypsum is the usual treatment, and it leaves pH unchanged.
A limey (calcareous) soil can’t really be changed, since its free lime neutralises any acid you apply140. The practical choices are to grow plants that suit it, use foliar sprays of iron, manganese or zinc, and keep acid-loving plants in raised beds or large pots.
Organic soils and potting mix
Peats, mucks and soilless potting mixes follow a different set of rules. Lucas and Davis produced an equivalent chart for organic soils, placing the best supply of most nutrients at about pH 5.0 to 5.5, roughly a full unit below mineral soil, chiefly because these materials contain little aluminium that could become toxic144,145.
That means a reading of 5.5 to 6 is perfectly acceptable in potting mix, but in garden clay it would indicate a need for lime (worth remembering when you make your own seed raising mix). If organic mixes are raised towards neutral, boron, copper, iron, manganese and zinc soon become scarce, so liming is generally recommended only below about pH 5.2 to 5.5145.
pH isn’t the whole story
Few gardening diagrams are as useful as Truog’s chart, but it shows directions of change, not quantities. In their 2023 review of its history, Hartemink and Barrow explain that pH by itself cannot predict what a plant will actually obtain, since soil minerals, organic matter, moisture, plant species and root activity all alter the picture3,146.
Use the chart to make sense of a struggling crop and work out which way to nudge conditions. Then learn your own soil, add organic matter (here’s how we build healthy soil for veggies), and pay attention to what your plants are telling you.
If you want help with the rest of the picture, continue with our free beginner’s guide to veggie gardening .
And in our Organic Vegetable Gardening course , we guide you through the whole process properly, one season at a time.
Let me know in the comments if there is anything we can improve.
Sources and notes (205)
Notes on the chart
- Curve values for Truog nutrients were read by eye from the PDA redrawing (cropnuts.com) at half-unit steps; precision beyond about ±0.1 is not meaningful.
- Cl, Ni, Co are not on Truog’s chart; their curves are qualitative directions from textbook knowledge (Weil & Brady), not verified online in this pass. Silicon was left out: pH effects on plant-available Si are not well established for a simple curve.
- Biology curves for bacteria and fungi are based on one long-term UK field gradient (Rousk et al. 2009, pH 4.0–8.3) and extrapolated beyond 8.3; nitrification and rhizobia curves are schematic from extension thresholds.
- All pH values in the chart are pH(water). Australian lab reports usually give pH(CaCl2), which reads about 0.6–1.2 units lower (Soil Quality / NSW DPI), not the 0.5–0.8 often quoted; convert before reading the chart.
- Gram-per-square-metre rates are conversions from US imperial extension figures and are starting points; a lab lime-requirement test is more reliable, especially on clays and high organic-matter soils.
- Earthworm curve is schematic: anchored on NSW DPI extension numbers for the acid end and one ten-year NSW liming trial; the alkaline fall-off is supported only qualitatively. Native Australian earthworms differ, and some are well adapted to acid soil.
- Crops with no pH range in the Planting Guide data are left out: Skirret, Good King Henry, Murnong.
Sources
- Truog, E. (1946). Soil reaction influence on availability of plant nutrients. Soil Science Society of America Proceedings, 11, 305–308. (Volume dated 1946, issued January 1947; Crossref lists it under Soil Science Society of America Journal, 1947.) doi.org/10.2136/sssaj1947.036159950011000c0057x Origin of the band diagram. DOI, volume, pages verified via Crossref; Hartemink & Barrow (2023) cite it as Truog 1946b, Soil Sci Soc Am Proc 11:305–308. Paper text itself not opened (paywalled). Diagram drawn for well-drained mineral soils of humid regions, with no data or references (per Kish 2024).
- Potash Development Association (UK). Detailed Truog pH chart (image), as reproduced by Crop Nutrition Laboratory Services (Cropnuts), ‘Soil pH and Nutrient Availability’. cropnuts.com/soil-ph-and-nutrient-availability Design inspiration. Cropnuts captions the image ‘Chart courtesy of Potash Development Association’ (pda.org.uk). Image: https://cropnuts.com/wp-content/uploads/2023/11/detailed-Truog-pH-chart-1024×717-1.jpg. Curves for N, P, K, S, Ca, Mg, Fe, Mn, B, Cu/Zn read from this image. Article has no author or date on page.
- Hartemink, A. E., & Barrow, N. J. (2023). Soil pH – nutrient relationships: the diagram. Plant and Soil, 486, 209–215. doi.org/10.1007/s11104-022-05861-z History and critique of the Truog diagram: band widths show relative availability, not amounts; concludes soil pH alone cannot predict nutrient availability. Metadata and reference list verified via Crossref; full text paywalled (abstract-level claims only).
- Kish, S. (2024, March 1). Soil pH and nutrients: Everything is local. CSA News / Soil Science Society of America. www.sciencesocieties.org/print/pdf/node/569 Plain-language account of the diagram’s limits: drawn for well-drained humid-region soils, no data in the 1947 paper; ‘directionally correct as a general guide’ (Mallarino, Iowa State).
- Manutec Pty Ltd (n.d.). Colour chart for soil pH [Soil pH Test Kit colour card, PDF]. Cavan, South Australia. fert.manutec.com.au/wp-content/uploads/2024/05/MANUTEC-Soil-pH-colour-Chart.pdf The ribbon, marker and crop colours on this page were sampled from the swatches in this PDF (pH 4 to 10 in half units; 9.5 and 10 share one swatch). Approximate: printed cards, real kit reactions and screens all differ.
- Soil Science Division Staff (2017). Soil survey manual (USDA Handbook 18; C. Ditzler, K. Scheffe & H. C. Monger, Eds.). Government Printing Office. www.nrcs.usda.gov/resources/guides-and-instructions/soil-survey-manual Background only: not checked against the original for this page. Reaction class names and boundaries (e.g. slightly acid 6.1–6.5, neutral 6.6–7.3) as reproduced by USDA NRCS soil quality materials; the manual table itself was not opened for this page.
- Manutec Pty Ltd (n.d.). Soil pH Test Kit: instructions [PDF]. “This test is based on research by CSIRO.” fert.manutec.com.au/wp-content/uploads/2024/05/Soil-pH-Test-Kit-instructions.pdf
- Gazey, P., revised by Alt, S. (2013). Soil acidity — New South Wales [Fact sheet]. Soil Quality / NSW Department of Primary Industries. s3.amazonaws.com/soilquality-production/fact_sheets/91/original/Chem_-_Soil_Acidity_%28NSW%29.pdf pH log scale (pH 4 has 10× the acid of pH 5, 100× pH 6); 1:5 soil:0.01 M CaCl2 standard; water pH 0.6–1.2 higher; field kits read like water pH; >half of intensively used NSW farmland acid; topsoil >5.2, subsoil >4.8 (CaCl2); processes favoured at pH 5.5–8; Al toxicity; lime rate depends on ECEC and lime quality (NV, fineness); sample in autumn, retest every 3–4 years.
- Angima, S. (2010). Measuring soil pH. Oregon State University Small Farms Program. smallfarms.oregonstate.edu/measuring-soil-ph Compared a colour kit, a soil probe and a hand-held meter against the average of 82 laboratories.
- Stevens, G., Dunn, D., & Phipps, B. (2001). How to diagnose soil acidity and alkalinity problems in crops: a comparison of soil pH test kits. Journal of Extension, 39(4), Article 23 (Tools of the Trade 4TOT3). University of Missouri. tigerprints.clemson.edu/joe/vol39/iss4/23 Opened 2026-11-20 (full text via https://web.archive.org/web/2020/https://archives.joe.org/joe/2001august/tt3.php). Portageville, Missouri cotton plots plus 3 NAPT soils vs 82 labs. Probe read 6.0 on soils at 7.9/6.3/5.6; hand-held meter 7.7/6.3/5.5, closest to labs. ‘Soil pH probes gave poor measurements of soil acidity and should not be used’. DOI as printed in the Clemson recommended citation.
- Kel Instruments. Kelway Soil Acidity and Moisture Tester Model HB-2: instructions (as distributed by Rittenhouse). www.mkrittenhouse.com/media/pdf/66_kelway-hb-2-manual.pdf The maker’s product pages (kelinstruments.com) give no accuracy or range figures, so none are quoted here.
- Hanna Instruments. Direct Soil Measurement pH Portable Meter, HI99121 [product page]. hannacan.com/product/direct-soil-measurement-ph-portable-meter-hi99121
- Bluelab. Getting started: the Bluelab Soil pH Pen [support page]. support.bluelab.com/bluelab-soil-ph-pen
- NSW Department of Primary Industries (2021). Soil acidity and liming (Agfact AC.19, 4th ed.). www.dpi.nsw.gov.au/agriculture/soils/guides/soil-acidity/soil-acidity-and-liming-2021-ac.19 Background only: not checked against the original for this page. 4th edition (2021), J. Condon and M. Conyers, NSW DPI web edition. Cited here only for white clover tolerating aluminium but not manganese, seen via search snippets; the full text was not opened.
- Gazey, P. (n.d.). Soil acidity [Fact sheet]. Soil Quality Pty Ltd / soilquality.org.au (GRDC-funded). www.soilquality.org.au/factsheets/soil-acidity About 50% of Australian agricultural land (50 Mha) has surface pH ≤5.5 (CaCl2) and 12–24 Mha has subsurface pH ≤4.8 (NLWRA 2001); water pH reads 0.6–1.2 units higher than CaCl2; targets topsoil >5.5, subsoil >4.8; rhizobia greatly reduced in acid soils; acidification causes.
- Beegle, D. B., & Lingenfelter, D. D. (2014). Soil acidity and aglime (Agronomy Facts 3). Penn State Extension. extension.psu.edu/soil-acidity-and-aglime One pH unit = tenfold change in acidity; P tied up by Al/Fe in acid soils and by Ca/Mg above pH 7, keep 5.5–6.8; Mo the exception among micronutrients; Al and Mn can reach toxic levels below pH 5.5; rhizobia decline below pH 6.0; nitrifiers need pH 5.5–6.5; CCE calcitic 100%, dolomitic 109%; lime takes several months, full reaction within ~3 years; little benefit above 8,000 lb CCE/acre in one go; gypsum is not a liming material.
- Incitec Pivot Fertilisers (2024). Agritopic: Fertilising parks, lawns and home gardens (Queensland). www.incitecpivot.com.au/siteassets/assets/documents/agritopics/18340—agritopic—parks-lawns-and-gardens-qld.pdf Opened 2026-11-20. Flowers and vegetables: ‘Where the soil is acidic and lime is required, broadcast lime on the garden bed at 250 g/m2 at least 2 – 3 months before planting’. ‘Repeat applications of lime are likely to be required every 2 – 5 years.’ Established lawns 125 – 250 g/m2.
- Saunders, O. (n.d.). Guide to using wood ash as an agricultural soil amendment. University of New Hampshire Cooperative Extension. extension.unh.edu/resource/guide-using-wood-ash-agricultural-soil-amendment Wood ash CCE 25–59% (lime 90–95%), so 2–4× the lime rate; ~5% K, ~25% Ca; a 1,000 sq ft garden at pH 6.5 needs no more than ~20 lb (~100 g/m²); keep away from blueberries, rhododendrons, scab-prone potatoes and germinating seed; never ash from treated or painted wood; don’t mix with ammonium fertilisers.
- Queensland Government (n.d.). Soil sodicity. Queensland Government website. www.qld.gov.au/environment/land/management/soil/soil-properties/sodicity pH >8.5 listed as an indicator of sodicity; ~45% of Queensland soils sodic; gypsum manages sodic soils; no defined gypsum rate.
- University of Tennessee Institute of Agriculture (n.d.). Blueberries (home garden fruit and nuts). UT Crops soil fertility recommendations. utcrops.com/soil/home-garden-fruit-and-nuts/blueberries Blueberry pH 4.8–5.5, keep near 5.0; elemental sulfur 2 lb per 1,000 sq ft per 0.1 unit above 5.5 on medium soils (~98 g/m² per pH unit), one-third more on clay, one-third less on sand; split if >30 lb/1,000 sq ft; apply ≥3 months before planting, work into top 3 in.
- Oregon State University Extension (n.d.). Growing blueberries in your home garden: acidifying soil with elemental sulfur. extension.oregonstate.edu/es/node/81671/printable/print Top-dress ~150 g sulfur per plant monthly up to 680 g; test pH before continuing; be cautious not to over-acidify; response may take until next spring/summer.
- Fertiliser Technology Research Centre, University of Adelaide (n.d.). Technical bulletin: Oxidation of elemental sulfur in soils. sciences.adelaide.edu.au/fertiliser/ua/media/74/factsheet-oxidation-of-elemental-sulfur-in-soils.pdf Opened 2026-11-20 via Wayback copy (live URL returned HTML to curl). Oxidation of elemental S is microbial (bacteria and fungi), needs water and oxygen, and ‘is more rapid in warm, moist soils with high organic matter (OM) contents’; temperature and pH have the largest effect.
- Cornell Cooperative Extension (2015). Blueberry information sheet: soil pH and sulfur. bpb-us-e1.wpmucdn.com/blogs.cornell.edu/dist/3/72/files/2015/12/Blueberry-Info-sheet-2ijmhnz-1pcenbj.pdf Established plantings: split spring/fall; never more than 4 lb/100 ft row or 3 oz per plant at once; ‘Higher rates of sulfur will burn or kill blueberry plants.’
- Montalvo Grijalva, D. F., Crozier, C. R., Smyth, T. J., & Hardy, D. H. (2010). Nitrogen, phosphorus, and liming effects of poultry layer manures in Coastal Plain and Piedmont soils. Agronomy Journal, 102(5), 1329-1339. doi.org/10.2134/agronj2009.0283 Replaces crozier2009 (2009 ASA poster PDF now 404, no archive). Abstract (OpenAlex, 2026-11-20): fresh, composted and pelleted layer manures changed soil pH consistently with their calcium carbonate equivalence. Closed access. (Replaces the 2009 conference poster, whose link died; id kept. 2026-11-20.)
- Hue, N. V. (1992). Chicken manure as a liming and aluminium-detoxifying amendment for an acid Ultisol. University of Hawaii CTAHR. www3.ctahr.hawaii.edu/TPSS/research_extension/soliresearch/biowaste/chicken.htm 5 g/kg chicken manure raised pH as much as 3.4 cmolc/kg hydrated lime; detoxified soluble Al.
- University of New Hampshire Extension (n.d.). Do pine needles acidify soil? extension.unh.edu/node/4638 Needles are acidic but cannot appreciably lower soil pH; a 2–3 inch layer won’t measurably change it.
- University of Delaware Cooperative Extension (2015). Mulches for blueberries. Weekly Crop Update. sites.udel.edu/weeklycropupdate/?p=7967 Pine needles listed as acidic mulch conserving moisture and protecting shallow roots; soil pH under mulches 4.9–5.6.
- Milkwood Planting Guide pH data (2026): the acceptable (tolerated) pH range shown for each crop runs from the second-lowest to the second-highest bound across its publishers’ widest stated ranges (preferred, or tolerated where a source gives one, including FAO Ecocrop’s absolute range), with each publisher counted once, so each end is reached by at least two publishers; drawn from extension services and FAO Ecocrop. The range each vegetable likes best, the fat part of its band in the vegetable chart, is the Planting Guide’s own preferred range: the median of the counted publishers’ lower and upper bounds. planting.milkwood.net
- Food and Agriculture Organization of the United Nations (FAO). Ecocrop crop data sheets (pH figures checked against the live data sheets, October 2026). ecocrop.apps.fao.org/ecocrop/srv/en/home
- Extension services behind the crop ranges, mainly: UConn Extension; University of Hawaii Cooperative Extension (McCall); Oklahoma State University Extension; Cornell Cooperative Extension; Ontario Ministry of Agriculture, Food and Rural Affairs; University of Arkansas Cooperative Extension; Oregon State University; Texas A&M AgriLife Extension; UC Statewide IPM; SARE; plus NSW and Northern Territory government guides. planting.milkwood.net The per-crop source list lives with the Milkwood Planting Guide data.
- Victorian Resources Online (archived). The effect of soil pH on supply of nutrients. Agriculture Victoria (archive hosted by CeRDI, Federation University). soilhealth.ccmaknowledgebase.vic.gov.au/vro_archive/statewide/pages/soilhealth_ph_nutrients.html pH 6.0–8.0 favourable for most nutrients; Mn, Fe, B, Cu, Zn more available at pH 4.5–6.5, so acidifying soils can show Mn and B toxicity; Truog diagram expanded from Pettinger 1935.
- Marschner, P. (Ed.) (2012). Marschner’s mineral nutrition of higher plants (3rd ed.). Academic Press / Elsevier. ISBN 978-0-12-384905-2. shop.elsevier.com/books/marschners-mineral-nutrition-of-higher-plants/marschner/978-0-12-384905-2
- Epstein, E., & Bloom, A. J. (2005). Mineral nutrition of plants: Principles and perspectives (2nd ed.). Sinauer Associates. ISBN 0-87893-172-4. openlibrary.org/works/OL5856994W Its concentration and function tables are cited as reproduced by Hawkins (2011); the element roles in the periodic table also lean on it.
- National Center for Biotechnology Information. PubChem Periodic Table of Elements. pubchem.ncbi.nlm.nih.gov/periodic-table
- Bryant, C. (reviewer), Oldham, L., & Jones, K. D. (2026). Micronutrients in Mississippi soils and plant nutrition (Publication P3726). Mississippi State University Extension. extension.msstate.edu/publications/micronutrients-mississippi-soils-and-plant-nutrition As pH rises from 4 to 7, Zn, Fe, Mn, Cu and B fall in availability and Mo rises; pH >7 causes B, Zn, Fe, Mn deficiencies; Mn very soluble below pH 5, toxicity at pH ≤5.3; deficiency symptoms and remedies for each micronutrient including Cl and Ni. Year inferred from print code.
- Cartwright, B., Zarcinas, B. A., & Spouncer, L. R. (1986). Boron toxicity in South Australian barley crops. Australian Journal of Agricultural Research, 37, 351–359. doi.org/10.1071/AR9860351 Boron toxicity in alkaline subsoils of southern Australia. Metadata verified via Crossref; Victorian soil-pit pages cite it and note B toxicity in strongly alkaline soils.
- Jackson, G. (2019). Cabbage boron deficiency (Fact sheet 290). Pacific Pests, Pathogens and Weeds. Lucid / ACIAR. apps.lucidcentral.org/ppp/text/web_full/entities/cabbage_boron_deficiency_290.htm
- Ontario Ministry of Agriculture, Food and Agribusiness (n.d.). Boron. Ontario Crop IPM: Soil diagnostics, micronutrients. Government of Ontario. cropipm.omafra.gov.on.ca/en-ca/soil-diagnostics/micronutrients/boron
- Gatiboni, L. (2022). Soils and plant nutrients, Chapter 1. In K. A. Moore & L. K. Bradley (Eds.), North Carolina Extension Gardener Handbook (2nd ed., AG-831). NC State Extension. content.ces.ncsu.edu/extension-gardener-handbook/1-soils-and-plant-nutrients
- Stephens, C. T., & Zandstra, B. H. (1983). Disorders of cole crops (Extension Bulletin E-1668). Michigan State University Cooperative Extension Service (archive copy). archive.lib.msu.edu/DMC/extension_publications/e1668/e1668-1983.pdf
- UC Statewide IPM Program (n.d.). Boron toxicity or other specific ions in excess. Home and Landscape. University of California Agriculture and Natural Resources. ipm.ucanr.edu/home-and-landscape/boron-toxicity-or-other-specific-ions-in-excess
- Adcock, D., McNeill, A. M., McDonald, G. K., & Armstrong, R. D. (2007). Subsoil constraints to crop production on neutral and alkaline soils in south-eastern Australia: a review of current knowledge and management strategies. Australian Journal of Experimental Agriculture, 47, 1245–1261. doi.org/10.1071/EA06250 Alkaline/sodic subsoil constraints incl. boron toxicity, salinity, sodicity. Metadata verified via Crossref; text not opened.
- Hawkins, B. J. (2011). Seedling mineral nutrition, the root of the matter. In L. E. Riley, D. L. Haase & J. R. Pinto (Eds.), National Proceedings: Forest and Conservation Nursery Associations 2010 (RMRS-P-65, pp. 87–97). USDA Forest Service, Rocky Mountain Research Station. npn.rngr.net/publications/proceedings/2010/seedling-mineral-nutrition-the-root-of-the-matter/at_download/file Table 1 (average and range of concentration in crop plant dry matter, from Epstein & Bloom 2005) gives the “how much plants need” figures; Table 2 (functions, adapted from Epstein & Bloom 2005) gives “why it matters”. Cobalt 0.1 ppm and sodium 10 ppm from the text.
- Hart, J. M., & McNeilan, R. A. (2000, reviewed 2025). Fertilizing your garden: Vegetables, fruits and ornamentals (EC 1503). Oregon State University Extension Service. extension.oregonstate.edu/catalog/ec-1503-fertilizing-your-garden-vegetables-fruits-ornamentals Organic N must be converted by microbes, so an early fast source (liquid fish, blood meal) may be needed; poultry manure ~75% of N available in year one vs 25-50% for other manures; fresh manure may burn and carry excess salts; wood ash a K source that raises pH, not above pH 7.0 or for acid-lovers, may trigger potato scab; ammonium sulfate supplies N and S and lowers pH; elemental sulfur lowers pH; borax 1 tablespoon per 100 sq ft (~9 m2) where soil B <1 ppm, excess highly toxic esp. to young beans, lasts up to 3 years.
- Gatiboni, L., & Ozlu, E. (2024). Chapter 9: Soil management. In North Carolina organic commodities production guide (AG-660). NC State Extension. content.ces.ncsu.edu/north-carolina-organic-commodities-production-guide/chapter-9-soil-management Organic-allowed sources by nutrient: N from legumes, manures, blood, feather meal (slow from litter/compost); P from rock phosphate, bone meal, manures (manure builds up P); K from greensand, sulfate of potash, mined KCl (minimise chloride build-up), plant ash, kelp; S from elemental S, gypsum, Epsom salt, sulfate of potash; Ca/Mg from calcitic or dolomitic lime, gypsum; micronutrient sulfates/oxides for Cu, Mn, Zn, Co, Fe, Mo; ‘avoid over-application of micronutrients as toxicities can occur’.
- UC Statewide IPM Program (n.d.). Nitrogen deficiency. Home and Landscape. University of California Agriculture and Natural Resources. ipm.ucanr.edu/home-and-landscape/nitrogen-deficiency
- UC Statewide IPM Program (n.d.). Nutrient deficiencies (vegetables). Home and Landscape. University of California Agriculture and Natural Resources. ipm.ucanr.edu/PMG/GARDEN/VEGES/ENVIRON/nutrient.html
- Zitter, T. A. (n.d.). Nutrient disorders (tomato diagnostic key, Vegetable MD Online). Cornell Vegetables, Cornell University. www.vegetables.cornell.edu/pest-management/keys-for-identifying-vegetable-diseases/tomato-diagnostic-key/tomato-wilt-crown-and-general-plant-decline/nutrient-disorders
- Card, A., Whiting, D., Wilson, C., Reeder, J., & Goldhamer, D. (2015, reviewed 2023). Organic fertilizers (CMG GardenNotes #234). Colorado State University Extension. extension.colostate.edu/resource/organic-fertilizers N-P-K and release times: blood meal 12-0-0 (1-4 months, can burn), bone meal 3-15-0 (P only available below pH 7.0 per CSU research), feather meal slow, fish emulsion 5-2-2, kelp meal valued for micronutrients not NPK, rock phosphate very slow and unavailable above pH 7.0; release needs soil above ~10 C and moisture.
- Saliga, R., III, & Skelly, J. (2013). Using chicken manure safely in home gardens and landscapes (Fact Sheet 13-23). University of Nevada Cooperative Extension. psdocs.spes.vt.edu/consumer/3_using_chicken_manure.pdf Raw chicken manure can burn plants (ammonia) and carry pathogens; compost or age it; composting in 5-6 weeks ‘cools’ it; composted manure gives slow-release N, P, K, Ca and micronutrients over a few years; apply 90 days before harvest (120 for ground-contact crops). Hosted on a Virginia Tech server. Does not discuss salts.
- Magdoff, F., & van Es, H. (2021). Building soils for better crops (4th ed.), Chapter 10: Cover crops. SARE Outreach. www.sare.org/publications/building-soils-for-better-crops/cover-crops Legumes grown to bud or flowering can supply 70 to well over 100 lb N/acre (~80-110+ kg N/ha) to the next crop; low-lignin legume residue decomposes and releases N quickly. Edition number not shown on the page; 2021 is the current (4th) edition per SARE.
- Hu, X., Wei, X., Ling, J., & Chen, J. (2021). Cobalt: an essential micronutrient for plant growth? Frontiers in Plant Science, 12, 768523. www.frontiersin.org/journals/plant-science/articles/10.3389/fpls.2021.768523/full Rhizobia need Co and cobalamin; Co limitation cuts leghaemoglobin synthesis and N fixation; Co-deficient legumes have fewer, smaller nodules; lupins sensitive; South Australia listed among low-Co regions; Co toxic at high levels and can induce Fe deficiency. The pages read did not cover pH effects on Co.
- Loganathan, P., Hedley, M. J., Grace, N. D., Lee, J., Cronin, S. J., Bolan, N. S., & Zanders, J. M. (2003). Fertiliser contaminants in New Zealand grazed pasture with special reference to cadmium and fluorine: a review. Australian Journal of Soil Research, 41(3), 501-532. doi.org/10.1071/SR02126
- Pilon-Smits, E. A. H., Quinn, C. F., Tapken, W., Malagoli, M., & Schiavon, M. (2009). Physiological functions of beneficial elements. Current Opinion in Plant Biology, 12(3), 267-274. doi.org/10.1016/j.pbi.2009.04.009
- Maathuis, F. J. M. (2014). Sodium in plants: perception, signalling, and regulation of sodium fluxes. Journal of Experimental Botany, 65(3), 849-858. doi.org/10.1093/jxb/ert326
- Victorian Resources Online (archived). Sodic soils. Agriculture Victoria (citing Northcote & Skene 1972; Ford et al. 1993). soilhealth.ccmaknowledgebase.vic.gov.au/vro_archive/statewide/pages/sodic_soils.html Sodic = ESP 6–14, strongly sodic ≥15 (Northcote & Skene 1972); sodic soils ~28% of the continent; ≥59% of Victorian soils (13.4 Mha) sodic, 37% of the state alkaline sodic (Ford et al. 1993); dispersion, crusting, hard-setting, waterlogging.
- UC Statewide IPM Program (n.d.). Nutrient and mineral excesses, salinity, and salt toxicity. Home and Landscape. University of California Agriculture and Natural Resources. ipm.ucanr.edu/PMG/GARDEN/ENVIRON/salttoxicity.html
- Rengasamy, P., & Olsson, K. A. (1991). Sodicity and soil structure. Australian Journal of Soil Research, 29, 935–952. doi.org/10.1071/SR9910935 Classic Australian sodicity reference; metadata verified via Crossref only.
- Tucker, B. M. (1985). The partitioning of exchangeable magnesium, calcium and sodium in relation to their effects on the dispersion of Australian clay subsoils. Australian Journal of Soil Research, 23(3), 405-416. doi.org/10.1071/SR9850405 Abstract only (OpenAlex, 2026-11-20): large amounts of exchangeable Mg have a deleterious effect on illitic subsoil clays because clays hold Mg slightly less strongly than Ca; Australian criteria exist for magnesium-affected subsoils.
- Chalker-Scott, L. (2007). Epsom salts: miracle, myth…or marketing. MasterGardener magazine (Spring 2007), Washington State University. s3.wp.wsu.edu/uploads/sites/403/2015/03/epsom-salts.pdf Epsom salts helps only genuinely Mg-deficient plants (light, sandy, acid, leached soils, or high K inducing deficiency); highly soluble, so under leaching it washes through as a pollutant; excess linked to leaf scorch and bitter pit; Mg residues can accumulate.
- Kochian, L. V., Hoekenga, O. A., & Piñeros, M. A. (2004). How do crop plants tolerate acid soils? Mechanisms of aluminum tolerance and phosphorous efficiency. Annual Review of Plant Biology, 55, 459–493. doi.org/10.1146/annurev.arplant.55.031903.141655 Al toxicity as the main limit in acid soils; metadata verified via Crossref only.
- Corangamite Catchment Management Authority (2013). Aluminium. In Brown Book, Corangamite region: How to optimise your soils to enhance productivity (prepared by AS Miner Geotechnical). Victorian soil health knowledge base. soilhealth.ccmaknowledgebase.vic.gov.au/brown_book/21_Aluminium.htm
- Kaur, S., Kaur, N., Siddique, K. H. M., & Nayyar, H. (2016). Beneficial elements for agricultural crops and their functional relevance in defence against stresses. Archives of Agronomy and Soil Science, 62(7), 905-920. doi.org/10.1080/03650340.2015.1101070
- Barrow, N. J. (2017). The effects of pH on phosphate uptake from the soil. Plant and Soil, 410, 401–410. (Online 2016.) doi.org/10.1007/s11104-016-3008-9 Modern view on P: pH effect on P uptake is not the simple Truog band. Metadata verified via Crossref only.
- Mississippi State University Extension (n.d.). Why is my young corn stunted and purple? Agriculture: Soils. extension.msstate.edu/agriculture/soils/why-my-young-corn-stunted-and-purple
- Spangenberg, B. (2025). Do garden soils need limestone or sulfur? Wisconsin Horticulture, UW-Madison Division of Extension. hort.extension.wisc.edu/articles/reducing-soil-ph Elemental sulfur preferred for lowering pH; avoid aluminium sulfate (Al toxicity); ammonium sulfate also lowers pH; never add lime or sulfur without a soil test.
- Chalker-Scott, L., & Guggenheim, R. (2018). Gypsum use in home gardens and landscapes (FS307E). Washington State University Extension. wpcdn.web.wsu.edu/wp-ecommerce/uploads/sites/2/product-3711-sku-FS307E.pdf Sulfate in gypsum does not form sulfuric acid and has no effect on soil pH; documented benefit is on sodic soils; claims that it acidifies soil or cures blossom end rot are unsupported.
- Montana State University News Service (2013, June 14). Lots of rain means mobile soil nutrients may be lacking (quoting C. Jones, MSU Extension soil fertility specialist). landresources.montana.edu/soilfertility/documents/PDF/PR/RainIncreasingNutrientLoss%202013.pdf Chloride is mobile and leaches with heavy rain, like N and S; rescue treatment is potassium chloride (muriate of potash, 0-0-60). A news release, field-crop context; weaker than an extension bulletin.
- Weil, R. R., & Brady, N. C. (2017). The nature and properties of soils (15th ed.). Pearson. www.pearson.com/en-us/subject-catalog/p/Weil-Natureand-Properties-of-Soils-The-15th-Edition/P200000000825 Background only: not checked against the original for this page. Standard textbook (not opened for this page). Cited for well-established points: cobalt and nickel availability fall as pH rises, chloride is a highly soluble anion largely unaffected by pH, and nitrification slows sharply in strongly acid soils. Also cited for the two-step nitrification pathway (Nitrosomonas/Nitrosospira, then Nitrobacter/Nitrospira).
- UC Statewide IPM Program (n.d.). Potassium deficiency. Home and Landscape. University of California Agriculture and Natural Resources. ipm.ucanr.edu/PMG/GARDEN/PLANTS/DISORDERS/potassiumdeficiency.html
- Brust, G. (updated 2024, October 22). Tomato ripening problems and the role of potassium. University of Maryland Extension. extension.umd.edu/resource/tomato-ripening-problems-and-role-potassium-0
- Goldberg, N. P. (n.d.). Blossom-end rot (Guide A-231). New Mexico State University Cooperative Extension Service. pubs.nmsu.edu/_a/A231.pdf
- Swoboda, P., Döring, T. F., & Hamer, M. (2022). Remineralizing soils? The agricultural usage of silicate rock powders: A review. Science of the Total Environment, 807, 150976. doi.org/10.1016/j.scitotenv.2021.150976 Abstract read via Semantic Scholar/Crossref: slow and inconsistent weathering restricted use; 48 crop trials show potential mainly on weathered tropical soils, ‘benefits for temperate soils are currently inconclusive’; best results from basalts and nepheline/glauconite rocks. Volume number from Crossref record, not checked on the publisher page.
- UC Statewide IPM Program (n.d.). Tipburn on lettuce and spinach. Home and Landscape. University of California Agriculture and Natural Resources. ipm.ucanr.edu/home-and-landscape/tipburn-on-lettuce-and-spinach
- Guan, W. (2022, October 31). Blackheart of celery. Purdue Plant and Pest Diagnostic Laboratory, Picture of the Week. Purdue University. ag.purdue.edu/department/btny/ppdl/potw-dept-folder/2022/blackheart-of-celery.html
- Lyu, S., Wei, X., Chen, J., Wang, C., Wang, X., & Pan, D. (2017). Titanium as a beneficial element for crop production. Frontiers in Plant Science, 8, 597. www.frontiersin.org/journals/plant-science/articles/10.3389/fpls.2017.00597/full
- Mus, F., Alleman, A. B., Pence, N., Seefeldt, L. C., & Peters, J. W. (2018). Exploring the alternatives of biological nitrogen fixation. Metallomics, 10(4), 523-538. doi.org/10.1039/C8MT00038G
- Rai, P. K., Lee, S. S., Zhang, M., Tsang, Y. F., & Kim, K.-H. (2019). Heavy metals in food crops: Health risks, fate, mechanisms, and management. Environment International, 125, 365-385. (Open access.) doi.org/10.1016/j.envint.2019.01.067
- Ontario Ministry of Agriculture, Food and Agribusiness (n.d.). Manganese. Ontario Crop IPM: Soil diagnostics, micronutrients. Government of Ontario. cropipm.omafra.gov.on.ca/en-ca/soil-diagnostics/micronutrients/manganese
- Piper, C. S. (1941). Marsh spot of peas: a manganese deficiency disease. The Journal of Agricultural Science, 31(4), 448–453. (Waite Agricultural Research Institute, Adelaide.) doi.org/10.1017/S0021859600049637
- Robertson, L. S., & Lucas, R. E. (1981 reprint). Essential micronutrients: Manganese (Extension Bulletin E-1031). Michigan State University Cooperative Extension Service (archive copy). archive.lib.msu.edu/DMC/extension_publications/e1031/e1031_81.pdf
- Card, A., Whiting, D., Reeder, J., & Wilson, C. (2015, reviewed 2023). Iron chlorosis of woody plants (CMG GardenNotes #223). Colorado State University Extension. extension.colostate.edu/resource/iron-chlorosis Soils are abundant in iron; problem is insolubility at high pH. Above pH 7.5 only EDDHA/EDDHMA chelates work; EDTA/DTPA fail above 7.2-7.5. Foliar sprays respond in days but are temporary; iron sulfate plus sulfur only on soils without free lime, slow.
- Tsai, H.-H., & Schmidt, W. (2020). pH-dependent transcriptional profile changes in iron-deficient Arabidopsis roots. BMC Genomics, 21, 694. pmc.ncbi.nlm.nih.gov/articles/PMC7539395 Full text opened 2026-11-20 (Europe PMC): ‘In aerated soils, the solubility of iron decreases by a factor of 1000 for each unit increase in pH between 4 and 9’.
- Brown, P. H., Welch, R. M., & Cary, E. E. (1987). Nickel: a micronutrient essential for higher plants. Plant Physiology, 85(3), 801–803. doi.org/10.1104/pp.85.3.801 Establishes Ni essentiality. Metadata verified via Crossref only; pH behaviour of Ni taken from textbook knowledge.
- Schulte, E. E., & Kelling, K. A. (1999, reprinted 2004). Soil and applied copper (Understanding Plant Nutrients, A2527). University of Wisconsin-Extension. corn.aae.wisc.edu/Management/pdfs/a2527.pdf
- Ontario Ministry of Agriculture, Food and Agribusiness (n.d.). Copper. Ontario Crop IPM: Soil diagnostics, micronutrients. Government of Ontario. cropipm.omafra.gov.on.ca/en-ca/soil-diagnostics/micronutrients/copper
- Schulte, E. E., & Kelling, K. A. (1999, reprinted 2004). Soil and applied copper (Understanding Plant Nutrients, A2527). University of Wisconsin–Extension. corn.aae.wisc.edu/Management/pdfs/a2527.pdf PDF read 2026-11-05: ‘Organic matter and soil pH are the predominant factors influencing copper availability’; ‘Organic matter binds copper more tightly than any other micronutrient’; liming increases copper held by clay and organic matter; check for deficiency above pH 7.5.
- Jeffery, J. J., & Uren, N. C. (1983). Copper and zinc species in the soil solution and the effects of soil pH. Australian Journal of Soil Research, 21(4), 479–488. doi.org/10.1071/SR9830479 Metadata and abstract verified via Crossref 2026-11-05. Limed sandy loam: zinc solubility decreased markedly with increasing pH (mostly free or labile Zn); copper species were largely moderately labile and non-labile and copper solubility varied only slightly with pH. Basis for drawing Zn steeper than Cu.
- White, P. J., & Broadley, M. R. (2009). Biofortification of crops with seven mineral elements often lacking in human diets: iron, zinc, copper, calcium, magnesium, selenium and iodine. New Phytologist, 182(1), 49-84. doi.org/10.1111/j.1469-8137.2008.02738.x
- Schulte, E. E. (reprinted 2004). Soil and applied zinc (Understanding Plant Nutrients, A2528). University of Wisconsin-Extension. corn.aae.wisc.edu/Management/pdfs/a2528.pdf
- Ontario Ministry of Agriculture, Food and Agribusiness (n.d.). Zinc. Ontario Crop IPM: Soil diagnostics, micronutrients. Government of Ontario. cropipm.omafra.gov.on.ca/en-ca/soil-diagnostics/micronutrients/zinc
- Schulte, E. E. (reprinted 2004). Soil and applied zinc (Understanding Plant Nutrients, A2528). University of Wisconsin–Extension. corn.aae.wisc.edu/Management/pdfs/a2528.pdf PDF read 2026-11-05: ‘Soil acidity (pH) influences the availability of zinc more than any other factor, with lower zinc solubility as the pH increases. Therefore, zinc deficiency usually is limited to soils with a pH above 6.5.’
- Stolz, J. F., and Oremland, R. S. (1999). Bacterial respiration of arsenic and selenium. FEMS Microbiology Reviews, 23(5), 615-627. pubs.usgs.gov/publication/70021244
- Zhang, Y., Romero, H., Salinas, G., and Gladyshev, V. N. (2006). Dynamic evolution of selenocysteine utilization in bacteria: a balance between selenoprotein loss and evolution of selenocysteine from redox active cysteine residues. Genome Biology, 7(10), R94. link.springer.com/content/pdf/10.1186/gb-2006-7-10-r94.pdf
- McCall, A. S., Cummings, C. F., Bhave, G., Vanacore, R., Page-McCaw, A., and Hudson, B. G. (2014). Bromine is an essential trace element for assembly of collagen IV scaffolds in tissue development and architecture. Cell, 157(6), 1380-1392. doi.org/10.1016/j.cell.2014.05.009
- Weir, R. G. (1984, revised 2004). Molybdenum deficiency in plants (Agfact AC.4, 2nd ed.). NSW Department of Primary Industries. ausveg.com.au/app/data/technical-insights/docs/TL27.pdf Mo needed in smaller amounts than any other minor element (~50 g/ha); often present in manure and seed; most deficiency where pH is 5.5 or less; lime or dolomite releases soil Mo but slowly (several months); vegetable seedbed rate 40 g sodium or ammonium molybdate in 50 L water per 10 m2, 1-2 weeks before transplanting. PDF hosted by AUSVEG.
- Ontario Ministry of Agriculture, Food and Agribusiness (n.d.). Molybdenum. Ontario Crop IPM: Soil diagnostics, micronutrients. Government of Ontario. cropipm.omafra.gov.on.ca/en-ca/soil-diagnostics/micronutrients/molybdenum
- McGee, C. F. (2020). The effects of silver nanoparticles on the microbial nitrogen cycle: a review of the known risks. Environmental Science and Pollution Research, 27, 31061-31073. agris.fao.org/search/en/records/65df693063b8185d9cacc6fa
- Abin, C. A., and Hollibaugh, J. T. (2013). Dissimilatory antimonate reduction and production of antimony trioxide microcrystals by a novel microorganism. Environmental Science and Technology, 48(1), 681-688. doi.org/10.1021/es404098z
- Baesman, S. M., Bullen, T. D., Dewald, J., Zhang, D., Curran, S., Islam, F. S., Beveridge, T. J., and Oremland, R. S. (2007). Formation of tellurium nanocrystals during anaerobic growth of bacteria that use Te oxyanions as respiratory electron acceptors. Applied and Environmental Microbiology, 73(7), 2135-2143. pmc.ncbi.nlm.nih.gov/articles/PMC1855670
- Kiferle, C., Martinelli, M., Salzano, A. M., Gonzali, S., Beltrami, S., Salvadori, P. A., Hora, K., Holwerda, H. T., Scaloni, A., & Perata, P. (2021). Evidences for a nutritional role of iodine in plants. Frontiers in Plant Science, 12, 616868. www.frontiersin.org/journals/plant-science/articles/10.3389/fpls.2021.616868/full
- Nascimento, C. W. A., Lima, L. H. V., Silva, Y. J. A. B., & Biondi, C. M. (2022). Ultramafic soils and nickel phytomining opportunities: a review. Revista Brasileira de Ciência do Solo, 46, e0210099. doi.org/10.36783/18069657rbcs20210099 Abstract read 2026-11-05: soils from ultramafic rocks such as peridotite and serpentinite are highly enriched in metals (Ni, Cr, Co) and depleted in P, K and Ca.
- Rousk, J., Brookes, P. C., & Bååth, E. (2009). Contrasting soil pH effects on fungal and bacterial growth suggest functional redundancy in carbon mineralization. Applied and Environmental Microbiology, 75(6), 1589–1596. pmc.ncbi.nlm.nih.gov/articles/PMC2655475 Across pH 8.3 to 4.0 (Hoosfield, Rothamsted): fivefold drop in bacterial growth and fivefold rise in fungal growth at low pH; bacterial growth fastest above pH 7, fungal growth peaked about pH 4.5.
- Ingham, E. R. (1999). The soil food web. In A. J. Tugel & A. M. Lewandowski (Eds.), Soil biology primer (PA-1637). USDA Natural Resources Conservation Service, Soil Quality Institute. www.agronomy.org/files/s4t/lessons/nrcs-soil-food-web-and-soil-biology-primer.pdf PDF opened 2026-11-06 (archived NRCS scan hosted by the Soil Science Society of America; year not printed on the scan, primer released 1999). Table ‘Typical numbers of soil organisms in healthy ecosystems’, per teaspoon (one gram dry) of agricultural soil: bacteria 100 million to 1 billion; fungi several yards of hyphae (prairie tens to hundreds of yards); earthworms per square foot: 5 to 30 agricultural, 10 to 50 prairie (about 54 to 538 per square metre). Bacteria chapter: ‘A teaspoon of productive soil generally contains between 100 million and 1 billion bacteria.’
- da Cruz Silva, G., Kitano, I. T., Ribeiro, I. A. F., & Lacava, P. T. (2022). The potential use of actinomycetes as microbial inoculants and biopesticides in agriculture. Frontiers in Soil Science, 2, 833181. doi.org/10.3389/fsoil.2022.833181 Opened 2026-11-06 (first 100k characters). Actinomycetes ‘can vary from 10^6 to 10^9 … per gram’ of soil and ‘represent more than 30% of the entire microbial population’; cites a study for Streptomyces making up more than 95% of soil actinobacteria (culture-based, treat with caution). No pH content.
- Lauber, C. L., Hamady, M., Knight, R., & Fierer, N. (2009). Pyrosequencing-based assessment of soil pH as a predictor of soil bacterial community structure at the continental scale. Applied and Environmental Microbiology, 75(15), 5111–5120. pmc.ncbi.nlm.nih.gov/articles/PMC2725504 Opened 2026-11-06. 88 soils from North and South America, forests below pH 4.5 to deserts above pH 8. Relative abundances of Acidobacteria, Actinobacteria and Bacteroidetes significantly correlated with pH (P < 0.05): Acidobacteria fell with pH; Actinobacteria and Bacteroidetes rose (Fig. 2, Fig. 5). Correlations only; no peaked fit for abundance.
- McGrath, M. T. (2021). Potato scab (originally by R. Loria for Vegetable MD Online). Cornell Vegetables, Cornell University. www.vegetables.cornell.edu/pest-management/disease-factsheets/potato-scab Opened 2026-11-06 (updated April 2021). Common scab ‘controlled or greatly suppressed at soil pH levels of 5.2 or lower’; ‘losses can rapidly increase with small increases in pH above 5.2’; S. acidiscabies (acid scab) grows down to pH 4.0; keep soil above -0.4 bars for the 2–6 weeks after tuber initiation; avoid or limit lime and manure, and manure can increase scab; nutrients most available near pH 6.5.
- Hammerschmidt, R., & Lacy, M. L. (1990). Diseases of potato: Common scab (Extension Bulletin E-2221). Michigan State University Extension. sanweb.lib.msu.edu/DMC/extension_publications/e2221/E2221-1990.PDF PDF opened 2026-11-06; archive copy marked not for current recommendations. Caused by the filamentous bacterium Streptomyces scabies. ‘Common scab does not generally occur in acidic soils that are at pH 5.0 to 5.3. Scab can be a serious problem, however, in soils at pH 5.5 to 7.5.’ Ammonium sulfate may help acidify soil and decrease scab.
- University of Maryland Extension (2021). Table B-1. Target soil pH values for vegetable crops. extension.umd.edu/sites/extension.umd.edu/files/2021-03/B-1.pdf Target pH and lime-below threshold per crop: most vegetables target 6.5 (lime below 6.0–6.2); asparagus 6.8 (6.2); scab-susceptible potatoes 5.2 (5.0); scab-resistant potatoes 6.2 (5.5); carrot 6.0 (5.5); strawberries 6.2 (5.8).
- Hermansson, A., & Lindgren, P.-E. (2001). Quantification of ammonia-oxidizing bacteria in arable soil by real-time PCR. Applied and Environmental Microbiology, 67(2), 972-976. pmc.ncbi.nlm.nih.gov/articles/PMC92675 Opened 2026-11-06. Swedish arable soil: about 6.2 x 10^7 ammonia-oxidizing bacteria per gram in fertilized soil, about 1.8 x 10^7 unfertilized; the authors note earlier (mostly culture-based MPN) counts in arable soils ran 1 to 2 orders of magnitude lower. Basis for the 10^5 to 10^7 per gram range shown on the nitrifier cell.
- Zhang, L.-M., Hu, H.-W., Shen, J.-P., & He, J.-Z. (2012). Ammonia-oxidizing archaea have more important role than ammonia-oxidizing bacteria in ammonia oxidation of strongly acidic soils. The ISME Journal, 6(5), 1032-1045. doi.org/10.1038/ismej.2011.168 Crossref details verified 2026-11-05 and DOI resolves; publisher page behind a bot check, so the claim rests on the title and well-known abstract (archaea dominate ammonia oxidation in strongly acid soils).
- Gubry-Rangin, C., Hai, B., Quince, C., et al. (2011). Niche specialization of terrestrial archaeal ammonia oxidizers. Proceedings of the National Academy of Sciences, 108(52), 21206-21211. doi.org/10.1073/pnas.1109000108 Crossref details verified 2026-11-05 and DOI resolves; publisher page behind a bot check. Known for showing distinct acidophilic archaeal ammonia-oxidiser lineages across soil pH.
- Daims, H., Lebedeva, E. V., Pjevac, P., et al. (2015). Complete nitrification by Nitrospira bacteria. Nature, 528(7583), 504-509. doi.org/10.1038/nature16461 Crossref details and abstract checked 2026-11-05: nitrification long seen as two steps by separate microbes; reports a Nitrospira that does both (comammox).
- van Kessel, M. A. H. J., Speth, D. R., Albertsen, M., et al. (2015). Complete nitrification by a single microorganism. Nature, 528(7583), 555-559. doi.org/10.1038/nature16459 Crossref details and abstract checked 2026-11-05: companion paper to Daims et al., Nitrospira species encoding all enzymes for complete nitrification.
- Farquharson, E. A., Ballard, R. A., Herridge, D. F., et al. (2022). Inoculating legumes: practice and science. Grains Research and Development Corporation, Australia. era.dpi.qld.gov.au/id/eprint/8594/1/Inoculating-Legumes-Practice-and-Science_FA_online_sm.pdf PDF opened 2026-11-05 (grdc.com.au/inoculating-legumes sits behind a bot check). Section 5.2: only specific rhizobia nodulate a given legume, hence inoculation groups; lupins by acid-tolerant Bradyrhizobium, medics by acid-sensitive Sinorhizobium; soybean (group H, Bradyrhizobium japonicum) is specific; peas group E/F, chickpea Mesorhizobium ciceri. Counts checked 2026-11-06 (pp. 66-68, sections 6.3 and 6.5): 100 to 1000 rhizobia/g soil needed for prompt nodulation; more than 1000/g in the top 10 cm at end of summer ‘not unusual’, a million/g measured in some instances, still under 0.1% of soil bacteria; near the root they multiply to 10,000/g and can exceed one million/g; about 40% of field pea, chickpea and lupin soils had under 100/g, while over 60% of medic and clover soils had 1000 or more.
- Peix, A., Ramírez-Bahena, M. H., Velázquez, E., & Bedmar, E. J. (2015). Bacterial associations with legumes. Critical Reviews in Plant Sciences, 34(1-3), 17-42. doi.org/10.1080/07352689.2014.897899 Crossref details verified 2026-11-05 (issue online 2014); review of rhizobial taxonomy across several alphaproteobacterial families and the betaproteobacterial rhizobia. Full text not opened.
- Moulin, L., Munive, A., Dreyfus, B., & Boivin-Masson, C. (2001). Nodulation of legumes by members of the β-subclass of Proteobacteria. Nature, 411(6840), 948-950. doi.org/10.1038/35082070 Crossref details verified 2026-11-05: first report of legume-nodulating bacteria outside the alpha-proteobacteria.
- Talbi, C., Delgado, M. J., Girard, L., Ramírez-Trujillo, A., Caballero-Mellado, J., & Bedmar, E. J. (2010). Burkholderia phymatum strains capable of nodulating Phaseolus vulgaris are present in Moroccan soils. Applied and Environmental Microbiology, 76(13), 4587-4591. doi.org/10.1128/aem.02886-09 Crossref details verified 2026-11-05: a beta-proteobacterium (Burkholderia, now Paraburkholderia, phymatum) nodulating common bean.
- Leininger, S., Urich, T., Schloter, M., Schwark, L., Qi, J., Nicol, G. W., Prosser, J. I., Schuster, S. C., & Schleper, C. (2006). Archaea predominate among ammonia-oxidizing prokaryotes in soils. Nature, 442(7104), 806–809. doi.org/10.1038/nature04983 Background only: not checked against the original for this page. Abstract seen via search index 2026-11-06; paper not opened (Nature PDF blocked). Twelve pristine and agricultural soils from three climate zones: archaeal amoA up to 3,000-fold more abundant than bacterial amoA; archaeal transcripts indicate in-situ activity. ‘Up to’ is a maximum, not a typical ratio.
- Nicol, G. W., Leininger, S., Schleper, C., & Prosser, J. I. (2008). The influence of soil pH on the diversity, abundance and transcriptional activity of ammonia oxidizing archaea and bacteria. Environmental Microbiology, 10(11), 2966–2978. doi.org/10.1111/j.1462-2920.2008.01701.x Abstract read 2026-11-06 via University of Aberdeen repository (https://abdn.elsevierpure.com/en/publications/the-influence-of-soil-ph-on-the-diversity-abundance-and-transcrip/). Soil pH gradient 4.9–7.5 (Craibstone, Scotland): ‘Archaeal amoA gene and transcript abundance decreased with increasing soil pH, while bacterial amoA gene abundance was generally lower and transcripts increased with increasing pH.’
- Lehtovirta-Morley, L. E., Stoecker, K., Vilcinskas, A., Prosser, J. I., & Nicol, G. W. (2011). Cultivation of an obligate acidophilic ammonia oxidizer from a nitrifying acid soil. Proceedings of the National Academy of Sciences, 108(38), 15892–15897. doi.org/10.1073/pnas.1107196108 Background only: not checked against the original for this page. Abstract seen via search index 2026-11-06 (PNAS page returns 403 to the fetcher; PMC copy at https://pmc.ncbi.nlm.nih.gov/articles/PMC3179093/ not opened). ‘Ca. Nitrosotalea devanaterra’: growth optimal at pH 4–5 and restricted to pH 4–5.5, unlike all previously cultivated ammonia oxidizers; grows and oxidises ammonia during nitrification in soil at pH 4.5.
- Stempfhuber, B., Engel, M., Fischer, D., et al. (2015). pH as a driver for ammonia-oxidizing archaea in forest soils. Microbial Ecology, 69(4), 879–883. doi.org/10.1007/s00248-014-0548-5 Author manuscript PDF opened 2026-11-06 (https://push-zb.helmholtz-munich.de/deliver.php?id=12455); volume and pages from memory, check via Crossref. 27 German forest topsoils: AOA:AOB amoA ratio increased sharply with decreasing pH; archaeal amoA 1 x 10^4 to 3.4 x 10^7 per g dry soil, highest at pH 3–4.5; bacterial amoA 2 x 10^4 to 4 x 10^6; AOA more abundant than AOB at most sites, though AOB often dominate well-fertilised soils.
- Smith, S., Manjarrez, M., & Smith, A. (n.d.). Arbuscular mycorrhizas – South Australia. Soil Quality factsheet. The University of Adelaide / soilquality.org.au. www.soilquality.org.au/factsheets/arbuscular-mycorrhizas-s-a Opened 2026-11-06. Hyphae branch through soil pores and widen the soil volume plants draw on, in exchange for sugars; nearly all crops form AM except lupins and brassicas such as canola (beet, spinach also non-hosts); tillage and fungicides reduce colonisation; minimum tillage protects hyphal links; long fallows and non-host sequences can cut uptake by the next crop; in one wheat study adding P did not significantly change the share of P delivered via AM. No pH content.
- Shen, Q., Kirschbaum, M. U. F., Hedley, M. J., & Camps Arbestain, M. (2016). Testing an alternative method for estimating the length of fungal hyphae using photomicrography and image processing. PLoS ONE, 11(6), e0157017. pmc.ncbi.nlm.nih.gov/articles/PMC4902305 Opened 2026-11-06. Hyphal lengths ‘typically reported in the literature (3–30 m g–1)’, citing Leake et al. (2004) Networks of power and influence, Canadian Journal of Botany 82:1016–1045. Range is for fungal hyphae generally, cited to a mycorrhizal review. Basis for the 10 m/g AMF cell.
- Göransson, P., Olsson, P. A., Postma, J., & Falkengren-Grerup, U. (2008). Colonisation by arbuscular mycorrhizal and fine endophytic fungi in four woodland grasses: variation in relation to pH and aluminium. Soil Biology & Biochemistry, 40(9), 2260–2265. doi.org/10.1016/j.soilbio.2008.05.002 Abstract read 2026-11-06 via Lund University record (https://www.lunduniversity.lu.se/lup/publication/c051acef-e767-424b-98d5-dd1b9cabb3c1). Southern Swedish oak forests: the grass on the least acid soil had the highest AM colonisation, the one on the most acid soil the lowest; within species, AM colonisation fell as easily reacting Al rose, more strongly than with pH. Abstract gives no numeric pH range or colonisation percentages.
- Kawahara, A., An, G.-H., Miyakawa, S., Sonoda, J., & Ezawa, T. (2016). Nestedness in arbuscular mycorrhizal fungal communities along soil pH gradients in early primary succession: acid-tolerant fungi are pH generalists. PLoS ONE, 11(10), e0165035. pmc.ncbi.nlm.nih.gov/articles/PMC5068792 Open access; abstract content confirmed via search index 2026-11-06 (author list from memory, check before publishing). Six Japanese sites, pH about 3.0–7.4: lower-pH AM communities were nested subsets of higher-pH ones; acid-soil fungi were pH generalists; acidifying a neutral-soil community changed it, neutralising an acid-soil community did not. Richness fell with acidity (stated in the first author’s thesis summary).
- van Aarle, I. M., Olsson, P. A., & Söderström, B. (2002). Arbuscular mycorrhizal fungi respond to the substrate pH of their extraradical mycelium by altered growth and root colonization. New Phytologist, 155(1), 173–182. doi.org/10.1046/j.1469-8137.2002.00439.x Abstract read 2026-11-06 via Lund University record (https://lup.lub.lu.se/record/146902). Plantago lanceolata with Scutellospora calospora or Glomus intraradices; extraradical mycelium in pH-buffered sand at about pH 5 or 6, roots unchanged. Both fungi formed more extraradical mycelium at the higher pH; G. intraradices almost none at the lower pH; total root colonisation was lower at the higher pH.
- Treseder, K. K. (2004). A meta-analysis of mycorrhizal responses to nitrogen, phosphorus, and atmospheric CO2 in field studies. New Phytologist, 164(2), 347–355. escholarship.org/uc/item/8783k14r eScholarship record and abstract seen via search 2026-11-06. Across field studies, mycorrhizal abundance fell 15% under N fertilisation and 32% under P fertilisation, and rose 47% under elevated CO2.
- NSW Department of Primary Industries and Regional Development. How earthworms can help your soil. Soil biology guides. www.dpird.nsw.gov.au/agriculture/soils/guides/soil-biology/earthworms Opened 2026-11-05 in headless Firefox (dpi.nsw.gov.au redirects here). Earthworms don’t like pH(CaCl2) below 4.5; lime raises pH and adds calcium, which worms need; South Australian research: numbers doubled as pH(CaCl2) rose 4.1 to 6.7; ‘do not like soil that is too acid, alkaline, dry, wet, hot or cold’; increase organic matter; tunnels aerate and speed drainage up to 10 times. Page states pH(CaCl2) 4.5 = about 5.0-5.3 in water (0.5-0.8 offset); this page uses 0.6-1.2.
- Hirth, J. R., Li, G. D., Chan, K. Y., & Cullis, B. R. (2009). Long-term effects of lime on earthworm abundance and biomass in an acidic soil on the south-western slopes of New South Wales, Australia. Applied Soil Ecology, 43(1), 106-114. doi.org/10.1016/j.apsoil.2009.06.007 DOI and bibliographic details verified via Crossref 2026-11-05; publisher page sits behind a bot check, abstract read via search index. Ten annual samplings, soil pH(CaCl2) about 4.0-4.2 in the top 20 cm; introduced species about three times more abundant in limed plots; native species neutral or negative to lime.
- North Carolina Department of Agriculture and Consumer Services, Agronomic Services (n.d.). Nutrient Concentrations in Compost. www.ncagr.gov/divisions/agronomic-services/waste-analysis/nutrient-concentrations-compost
- C Lee Burras, Iowa State University Extension and Outreach (2025). Selecting and Using Organic Fertilizers. yardandgarden.extension.iastate.edu/how-to/selecting-and-using-organic-fertilizers
- Wade W. McCall, Hawaii Cooperative Extension Service (1980). Chicken Manure (General Home Garden Series No. 2). www3.ctahr.hawaii.edu/oc/freepubs/pdf/GHGS-02.pdf
- Yates Australia (n.d.). Yates Blood & Bone Meal 1000kg product label. hortag.com.au/wp-content/uploads/2023/09/Yates_Blood_and_Bone_Meal_1T_Label.pdf
- Zack Snipes, Clemson Cooperative Extension (HGIC 1659) (2023). Understanding Organic Fertility. hgic.clemson.edu/factsheet/understanding-organic-fertility
- National Institute of Standards and Technology (2026). Standard Reference Material 3232 Kelp Powder (Thallus laminariae), Certificate of Analysis. tsapps.nist.gov/srmext/certificates/3232.pdf
- Omar Ali, Adesh Ramsubhag, Jayaraj Jayaraman (2021). Biostimulant Properties of Seaweed Extracts in Plants: Implications towards Sustainable Crop Production. Plants 10(3):531. pmc.ncbi.nlm.nih.gov/articles/PMC8000310
- Mark Reiter, Virginia Cooperative Extension (2020). Common Fertilizers Used in Virginia: Secondary and Micronutrients (SPES-200NP). ext.vt.edu/content/dam/pubs_ext_vt_edu/spes/spes-200/SPES-200.pdf
- Stephanie Alt and Paul Milham, NSW Department of Primary Industries (Soil Quality fact sheet) (n.d.). Molybdenum – NSW. www.soilquality.org.au/factsheets/molybdenum-nsw
- Colorado State University Extension (n.d.). Changing soil pH. extension.colostate.edu/resource/changing-soil-ph Opened 2026-11-20. Where soil contains naturally occurring lime, lowering pH is ‘difficult to impossible, cost prohibitive, and thus impractical’; 2% lime in the top 6 in needs ~6.5 t/ac sulfur just to neutralise it; vinegar fizz test for lime.
- Wightwick, A. M., Mollah, M. R., Partington, D. L., & Allinson, G. (2008). Copper fungicide residues in Australian vineyard soils. Journal of Agricultural and Food Chemistry, 56(7), 2457–2464. pubmed.ncbi.nlm.nih.gov/18321047 Abstract read via PubMed 2026-11-05: 96% of 98 vineyards across 10 Australian regions had soil copper above nearby native soil, from copper fungicides (6 to 150 mg/kg). Vineyards only; cited for copper building up under years of copper sprays.
- van der Ent, A., Jaffré, T., L’Huillier, L., Gibson, N., & Reeves, R. D. (2015). The flora of ultramafic soils in the Australia–Pacific Region: state of knowledge and research priorities. Australian Journal of Botany, 63(4), 173-190. doi.org/10.1071/BT15038 Abstract only (OpenAlex, 2026-11-20): ultramafic outcrops in Tasmania small; in Queensland much larger (553 species); also extensive in Western Australia. NSW not named in the abstract.
- Horticulture Australia / AUSVEG (2003). Managing cadmium in vegetables (VEGEnotes TL50). ausveg.com.au/app/data/technical-insights/docs/TL50.pdf PDF read 2026-11-05: ‘The availability of cadmium to plants decreases as soil pH increases’; soil below pH 5.5 (water) should be limed up to 6.2 to 6.7 (water).
- Lucas, R. E., & Davis, J. F. (1961). Relationships between pH values of organic soils and availabilities of 12 plant nutrients. Soil Science, 92(3), 177–182. doi.org/10.1097/00010694-196109000-00005 Organic-soil version of the diagram. DOI verified via Crossref; chart verified as reproduced in Lucas (1982) Figure 31.
- Lucas, R. E. (1982). Organic soils (Histosols): Formation, distribution, physical and chemical properties and management for crop production (Research Report 435). Michigan State University Agricultural Experiment Station and Cooperative Extension Service. archive.lib.msu.edu/DMC/extension_publications/RR435/RR435.pdf Figure 31 (p. 38) reproduces the organic-soil availability chart (pH 4.0–8.0, 12 nutrients). Also: 1,000 lb/acre sulfur lowers the top 6 in of organic soil about 0.4 pH units; liming organic soils recommended below about pH 5.2–5.5.
- Barrow, N. J., & Hartemink, A. E. (2023). The effects of pH on nutrient availability depend on both soils and plants. Plant and Soil, 487, 21–37. doi.org/10.1007/s11104-023-05960-5 Companion paper: pH effects on plant uptake (root physiology) matter as much as soil chemistry. Metadata verified via Crossref; full text not opened.
- A.L. Heinrich, A. Stone, D.M. Sullivan, J. Myers and E. Peachey, Oregon State University Extension (2016). Integrated Clubroot Management for Brassicas: Nonchemical control strategies (EM 9148). extension.oregonstate.edu/sites/extd8/files/documents/em9148.pdf
- Caroline Donald, Department of Primary Industries Victoria (2006). Clubroot of cruciferous crops (Agriculture Note AG0531). ausveg.com.au/app/data/technical-insights/docs/AG0531_Clubroot_of_Cruciferous_Crops.pdf
- R. G. Weir, NSW Department of Primary Industries (2004). Molybdenum deficiency in plants (Agfact AC.4, second edition, revised August 2004). ausveg.com.au/app/data/technical-insights/docs/TL27.pdf
- Emmanuel Torres Quezada, NC State Extension (2024). The Importance of Boron in Vegetable Crop Nutrition in North Carolina. content.ces.ncsu.edu/the-importance-of-boron-in-vegetable-crop-nutrition-in-north-carolina
- Gordon Johnson, University of Delaware Cooperative Extension (2023). Boron and Molybdenum in Vegetable Crops (Weekly Crop Update). sites.udel.edu/weeklycropupdate/?p=22766
- L. S. Robertson, D. D. Warncke and B. D. Knezek, Michigan State University Extension (1981). Molybdenum: An Essential Plant Nutrient (Ag Facts, archive copy). archive.lib.msu.edu/DMC/extension_publications/e1518/e1518-1981.pdf
- University of Maine Cooperative Extension (2010). Clubroot of Crucifers (Pest Management Fact Sheet #5096). extension.umaine.edu/ipm/?p=4575
- Caroline Donald, Department of Primary Industries Victoria (2006). Clubroot of cruciferous crops (Agriculture Note AG0531). ausveg.com.au/app/data/technical-insights/docs/AG0531_Clubroot_of_Cruciferous_Crops.pdf
- J. W. B. Stewart and S. McConaghy (1963). Some effects of reaction (pH) changes in a basaltic soil on the mineral composition of growing crops. api.crossref.org/works/10.1002/jsfa.2740140903
- Umesh C. Gupta and J. A. Cutcliffe (1972). Effects of Lime and Boron on Brown-heart, Leaf Tissue Calcium/Boron Ratios, and Boron Concentrations of Rutabaga. agris.fao.org/search/en/records/65dfba354c5aef494fe4ae98
- J.W. Pscheidt and C.M. Ocamb (senior eds), Pacific Northwest Extension (2026). Turnip and Rutabaga (Brassica spp.)-Boron Deficiency. pnwhandbooks.org/node/3640/print
- Washington State University Extension (2026). Turnip, Rutabaga: Boron deficiency. hortsense.cahnrs.wsu.edu/fact-sheet/turnip-rutabaga-boron-deficiency
- National Clubroot Project (Agriculture Victoria and state agencies) (2008). Keeping Clubroot Out (National Clubroot Project, TL62). ausveg.com.au/app/data/technical-insights/docs/TL62.pdf
- Gordon Johnson, University of Delaware Cooperative Extension (2018). Calcium and Boron Deficiencies in Brassica Crops. sites.udel.edu/weeklycropupdate/?p=12446
- E. Davison and A. McKay, Agriculture Western Australia (1999). Farmnote 29/99: Cavity spot disease of carrots. ausveg.com.au/app/data/technical-insights/docs/f02999.pdf
- AUSVEG (2020). Investigating cavity spot and forking in carrots. ausveg.com.au/article/investigating-cavity-spot-and-forking-in-carrots
- Pacific Northwest Pest Management Handbooks (2026). Celery (Apium graveolens var. dulce)-Cracked Stem (Brown Checking). pnwhandbooks.org/plantdisease/host-disease/celery-apium-graveolens-var-dulce-cracked-stem-brown-checking
- The Connecticut Agricultural Experiment Station (n.d.). Celery, Celeriac (Apium). portal.ct.gov/caes/plant-pest-handbook/pphc/celery-celeriac-apium
- O.P. Aishwath, B.K. Jha, R.S. Mehta, R.K. Yadav, R.L. Meena, R.S. Meena (2021). Response of Coriandrum sativum with variable soil pH of Typic Haplustalfs and Typic Heplustepts. epubs.icar.org.in/index.php/IJSS/article/view/160699
- University of Kentucky Vegetable IPM Team (n.d.). Zinc Deficiency (Scouting Guides for Problems of Vegetables). veggiescout.mgcafe.uky.edu/zinc-deficiency
- Gordon Johnson, University of Delaware Cooperative Extension (Weekly Crop Update) (2014). Low pH in Plastic Mulched Beds, Manganese Toxicity in Cantaloupes. sites.udel.edu/weeklycropupdate/?p=7044
- Purdue University, Southwest Purdue Agricultural Program (n.d.). Manganese toxicity of Cantaloupe. ag.purdue.edu/department/arge/swpap/manganese-toxicity-cantaloupe.html
- Mississippi State University Extension Service (n.d.). Why are my young watermelon leaves crinkled and pale?. extension.msstate.edu/agriculture/crops/commercial-horticulture/watermelon-cantaloupe-and-cucumber/why-are-my-young-watermelon-leaves-crinkled-and-pale
- Kim Hurst, University of Arkansas Cooperative Extension (2006). Identifying and Managing Manganese Toxicity in Watermelon (Plant Health Clinic Newsletter 2006, Issue 11). www.uaex.uada.edu/yard-garden/plant-health-clinic/docs/2006_Plant_Health_Clinic_Newsletters/Plant%20Health%20Clinic%20Newsletter%202006%20-%20Issue%2011.pdf
- Brett Upjohn, Greg Fenton, Mark Conyers (NSW Department of Primary Industries) (2005). Soil acidity and liming (Agfact AC.19, 3rd edition). soilhealth.ucdavis.edu/download_file/view/136/223
- D. R. Cosgrove, E. A. Oelke, J. D. Doll, D. W. Davis, D. J. Undersander, E. S. Oplinger (1991). Jerusalem artichoke (Alternative Field Crops Manual). corn.agronomy.wisc.edu/Crops/JerusalemArtichoke.aspx
- T. S. Schubert, Florida Department of Agriculture and Consumer Services, Division of Plant Industry (1992). Manganese Toxicity of Plants in Florida (Plant Pathology Circular No. 353). ccmedia.fdacs.gov/content/download/11360/file/pp353.pdf
- Thomas Gulya, Susan Thompson, Malcolm Ryley, Pax Blamey, R. Jay Goos and others (NDSU Extension) (2023). Sunflower Nutritional Disorders Diagnostic Series (PP2086). ndsu.edu/agriculture/sites/default/files/2023-07/pp2086.pdf
- Adamczyk-Szabela, D. and Wolf, W.M. (Molecules 27: 4671) (2022). The Impact of Soil pH on Heavy Metals Uptake and Photosynthesis Efficiency in Melissa officinalis, Taraxacum officinalis, Ocimum basilicum. mdpi-res.com/d_attachment/molecules/molecules-27-04671/article_deploy/molecules-27-04671.pdf
- J.M. Hart, D.M. Sullivan, M.E. Mellbye, A.G. Hulting, N.W. Christensen, G.A. Gingrich (2010). Nutrient Management: Peppermint (Western Oregon), EM 9018-E. extension.oregonstate.edu/sites/extd8/files/documents/em9018.pdf
- L.H. Ilkiu-Vidal, J.R.P. Souza, R.A.G. Viani (2010). Action of potentials of hydrogen on growth and productivity of sage (Salvia officinalis L.). www.scielo.br/j/rbpm/a/ccfzt5Z5pTkJT86cH8pPHKL/abstract/?lang=en
- S. Ouertatani, K. Regaya, J. Ryan and A. Gharbi (2011). Soil Liming and Mineral Fertilization for Root Nodulation and Growth of Faba Beans in an Acid Soil in Tunisia. repo.mel.cgiar.org/handle/20.500.11766/12158
- Gordon Johnson, University of Delaware Cooperative Extension (2019). Low pH and Nutrient Deficiencies in Vegetables (Weekly Crop Update). sites.udel.edu/weeklycropupdate/?p=13207
- E.E. Schulte and K.A. Kelling, University of Wisconsin-Extension (1999). Understanding Plant Nutrients: Soil and Applied Manganese (A2526). corn.aae.wisc.edu/Management/pdfs/a2526.pdf
- P.G. Hartel, A.M. Whelan and M. Alexander (1983). Nodulation of cowpeas and survival of cowpea rhizobia in acid, aluminum-rich soils. www.osti.gov/biblio/6980069
- Crop Protection Network (NC State University and Iowa State University IPM) (2026). Iron (Fe) Deficiency Chlorosis (IDC) of Soybean. cropprotectionnetwork.org/encyclopedia/iron-fe-deficiency-chlorosis-idc-of-soybean
- David L. Jordan, North Carolina State University Extension (2025). 2025 Peanut Information, Chapter 3: Peanut Production Practices. content.ces.ncsu.edu/pdf/peanut-production-practices/2025-01-08/3._ON_PRACTICES.pdf
- D.M. Sullivan, D.A. Horneck and D.J. Wysocki, Oregon State University Extension (2013). Eastern Oregon Liming Guide (EM 9060). extension.oregonstate.edu/sites/default/files/documents/em9060.pdf
- Teagasc, Agriculture and Food Development Authority (Ireland) (2025). Alliums (vegetable crops soil fertility). teagasc.ie/environment/soil/soil-fertility/vegetable-crops/alliums
- Emmanuel Torres Quezada and Chris Gunter, NC State Extension (2012). Asparagus Production. content.ces.ncsu.edu/publication/asparagus-crown-production
- Rhoda Burrows, South Dakota State University Extension (2019). Growing Asparagus. extension.sdstate.edu/sites/default/files/2019-03/P-00078.pdf
- Richard Brzozowski, University of Maine Cooperative Extension (2015). Growing Rhubarb in Maine (Bulletin #2514). extension.umaine.edu/publications/2514e
- Shengrui Yao and Robert Flynn, NMSU Cooperative Extension Service (n.d.). Home Garden Strawberry Production in New Mexico (Guide H-324). pubs.nmsu.edu/_h/H324.pdf
- Province of Manitoba, Agriculture (n.d.). Strawberry – Other Problems. www.gov.mb.ca/agriculture/crops/crop-management/fruit-crops/strawberry-other-problems.html
- North Carolina Department of Agriculture and Consumer Services (n.d.). Strawberry Fertility Management. ncagr.gov/ncdacs-strawberry-fertility-manual/open
- Lorin M. Harvey and Mark W. Shankle, Mississippi State University Extension (2022). Growing Sweet Potatoes at Home (P2784). www.accessibility.extension.msstate.edu/publications/growing-sweet-potatoes-home
- Texas A&M AgriLife Extension (n.d.). Sweet Potato | Texas Plant Disease Handbook. plantdiseasehandbook.tamu.edu/food-crops/vegetable-crops/sweet-potato
- Food and Agriculture Organization of the United Nations (2013). Save and Grow: Cassava. Chapter 5, Crop nutrition. www.fao.org/4/i3278e/i3278e03.pdf
- F. Abruna-Rodriguez, J.I. Vicente-Chandler, E. Rivera, J. Rodriguez (1982). Effect of soil acidity factors on yields and foliar composition of tropical root crops. www.osti.gov/biblio/5681095
- Reinhardt Howeler, Centro Internacional de Agricultura Tropical (n.d.). Fertility maintenance and liming of cassava. cgspace.cgiar.org/server/api/core/bitstreams/8aa0d0b8-57ee-4758-9dd6-47afebeb5b63/content
- Oklahoma Cooperative Extension Service (n.d.). Okra Production (HLA-6025). pods.okstate.edu/fact-sheets/HLA-6025pod.pdf
- Susan C. Miyasaka, Randall T. Hamasaki, Ramon S. de la Pena, University of Hawaii CTAHR (2002). Nutrient Deficiencies and Excesses in Taro (Soil and Crop Management SCM-4). www3.ctahr.hawaii.edu/oc/freepubs/pdf/SCM-4.pdf
- Rachel Rudolph, University of Kentucky Cooperative Extension (2019). Blossom End Rot (CCD-FS-11). ccd.uky.edu/sites/default/files/2024-12/ccd-fs-11_blossom_end_rot.pdf
- Cindy Fake, UC Cooperative Extension, Nevada and Placer Counties (2010). Managing Blossom-End Rot in Tomatoes and Peppers (31-040C). class.ucanr.edu/sites/default/files/2011-04/86509.pdf
- Grahame Jackson, Pacific Pests, Pathogens, Weeds & Pesticides (Lucidcentral) (2023). Potato common scab (293). apps.lucidcentral.org/pppw_v12/text/web_full/entities/potato_common_scab_293.htm
- University of Wisconsin Extension (2004). Soil and Applied Manganese (A2526). corn.aae.wisc.edu/Management/pdfs/a2526.pdf
- Gregory Welbaum, Virginia Tech (2005). Vegetable Seed Production: Beet. welbaum.spes.vt.edu/seedproduction/beets.html
- SRUC (SAC Consulting), Farm Advisory Service Scotland (2017). Technical Note TN671: Management of boron in soils for crops. fas.scot/downloads/technical-note-tn671-management-boron-soils-crops
- Oregon State University, Department of Horticulture (1988). Effect of Cultivar, Soil pH, and Insecticide on Foliar Disorders and Growth of Spinach (1988). agsci.oregonstate.edu/oregon-vegetables/effect-cultivar-soil-ph-and-insecticide-foliar-disorders-and-growth-spinach-1988